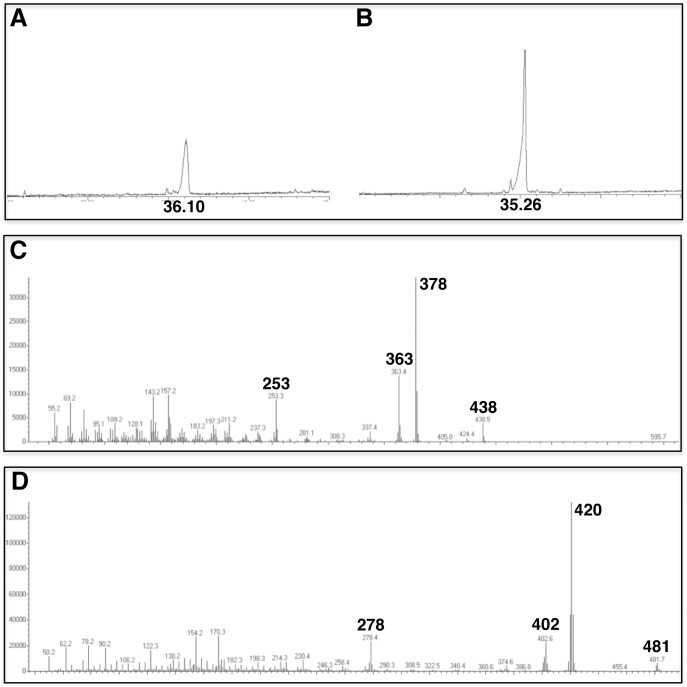
Figure 5. GC-MS analysis of ergosterol isotopomers from Pichia pastoris unsaponifiable extracts.
A, TIC of an acetylated extract from cells grown in hydrogenated medium. The peak at RT = 36.10 min is ergosterol. B, TIC of an acetylated extract from cells grown in deuterated medium. The peak at RT = 35.26 min is deuterioergosterol. C, mass spectrum of ergosteryl acetate. Prominent ions and interpretation of the fragmentation pattern: M+(438), M+-acetate-H (378), M+-acetate-H-CH3 (363), M+-acetate-H-side chain (253). D, mass spectrum of deuterioergosteryl acetate. Prominent ions and interpretation of the fragmentation pattern: M+(481), M+-acetate-D (420), M+-acetate-D-CD3 (402), M+-acetate-D-side chain (278).

