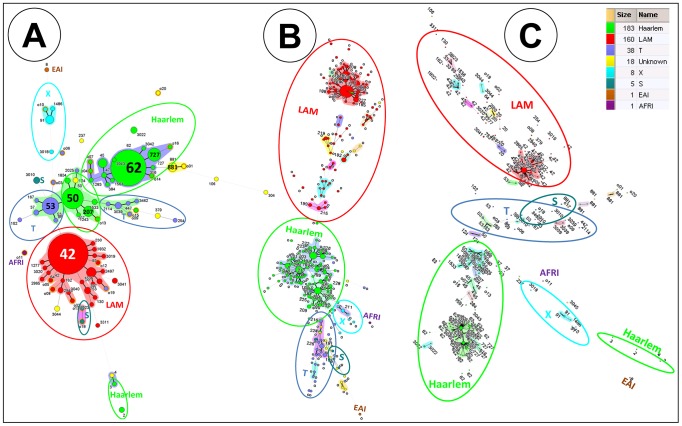
Figure 1. Minimum spanning tree (MST) illustrating evolutionary relationships between M. tuberculosis spoligotypes identified in our study.
(A). MST constructed with spoligotyping. (B) MST constructed with 24-locus MIRU-VNTR (C) Composite MST with spoligotyping and MIRU-VNTRs markers. MST were constructed on all isolates (n = 414, including 20 orphan patterns). The phylogenetic tree connects each genotype based on degree of changes required to go from one allele to another. The structure of the tree is represented by branches (continuous vs. dashed and dotted lines) and circles representing each individual pattern. Note that the length of the branches represents the distance between patterns while the complexity of the lines (continuous, gray dashed and gray dotted) denotes the number of allele/spacer changes between two patterns: solid lines, 1 or 2 or 3 changes (thicker ones indicate a single change, while the thinner ones indicate 2 or 3 changes); gray dashed lines represent 4 changes; and gray dotted lines represent 5 or more changes. The size of the circle is proportional to the total number of isolates in our study, illustrating unique isolates (smaller nodes) versus clustered isolates (bigger nodes). The color of the circles indicates the phylogenetic lineage to which the specific pattern belongs. Note that orphan patterns are circled in orange. Patterns colored in yellow indicate a strain with an unknown signature (unclassified).

