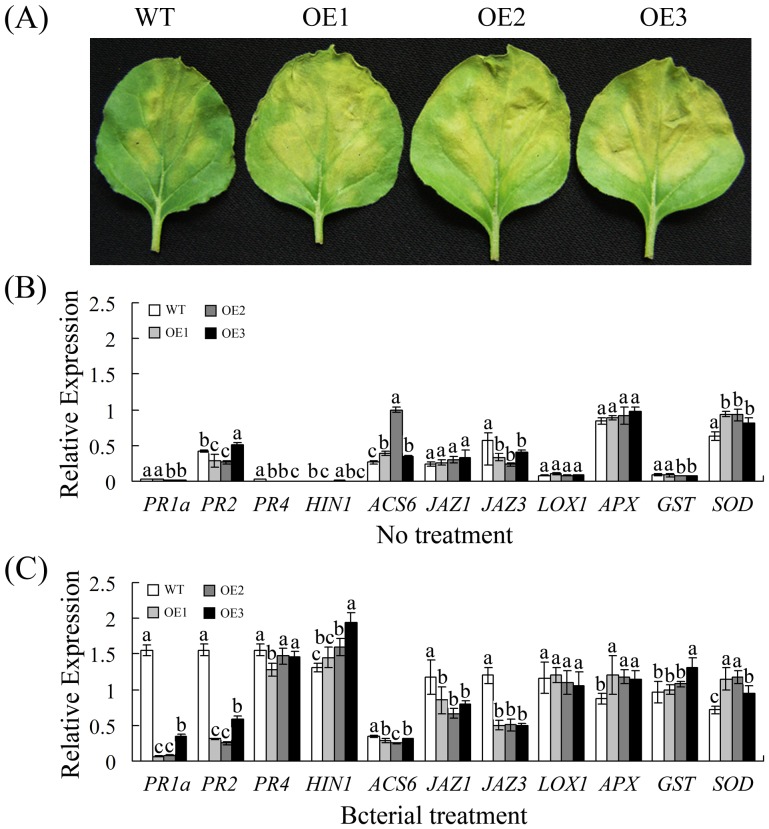
Figure 6. GhWRKY40 overexpression enhances susceptibility to R. Solanacearum in transgenic plants.
(A) Phenotype of WT and OE lines after 5 days of incubation with R. solanacearum. (B–C) Relative transcript levels of defense-related genes in non-infected and infected WT and OE plants were analyzed by qPCR. The data are presented as the mean ± standard error of three independent experiments. The values indicated by the different letters are significantly different at P<0.01, as determined using Duncan's multiple range tests.

