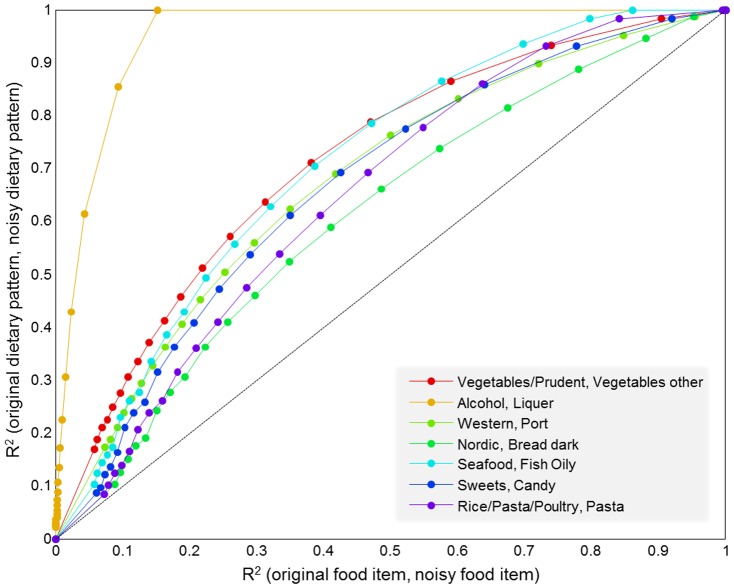
Figure 5. Comparison of the effect of random error in raw data and derived dietary factors.
For each level of error (Signal to noise ratio = (∞, …, 0.1)) the correlation (R2) between matched pairs of components from original model and model build on data plus Gaussian noise (y-axis) are matched with the correlation between the original data and the original data plus error for the most influential variable of the respective component (x-axis). The results are the average over 100 repetitions.

