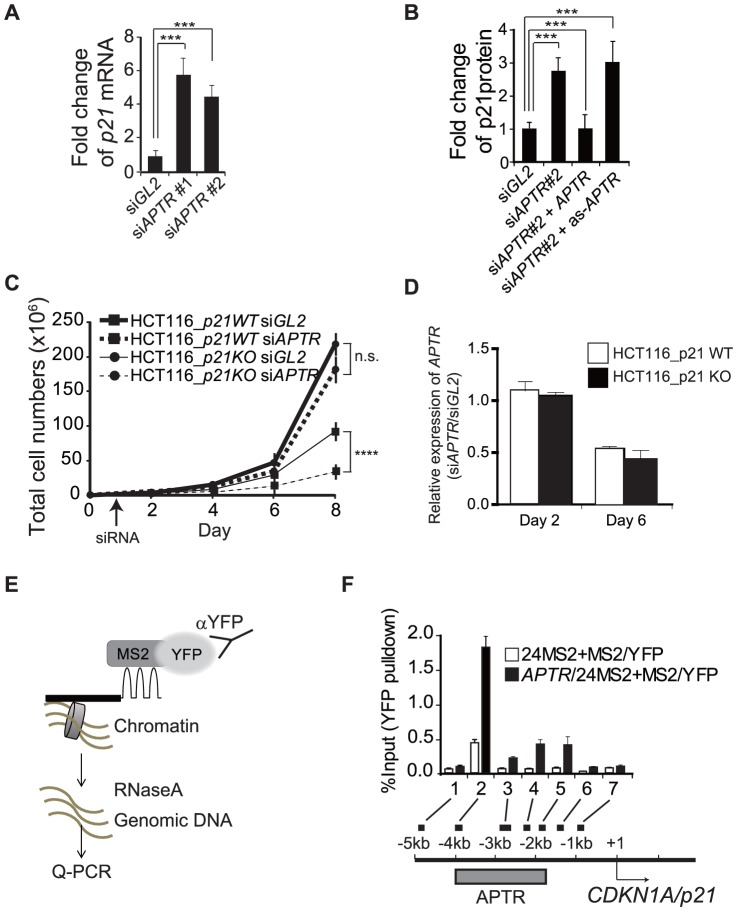
Figure 3. APTR suppresses p21 transcription.
(A) Q-RT-PCR shows induction of p21 mRNA (normalized to GAPDH) after siAPTR. Fold change compared to siGL2-transfected 293T cells (mean ±s.e.m., n>6, ***: P<0.0005). (B) The induction of p21 protein in the siAPTR#2 transfected 293T cells is prevented by overexpression of sense but not antisense APTR. Fold change of p21 normalized to ACTIN, compared to siGL2-transfected cells (mean ±s.e.m., n>3, **: P<0.005). (C) Growth suppression after siAPTR is alleviated in p21 −/− HCT116 cells. Mean ±s.e.m. n = 9. Right: APTR expression levels (Normalized to GAPDH) measured by Q-RT-PCR in p21 +/+ or p21 −/− HCT116 cells at the indicated days after transfection of siRNAs (n.s.: not significant, ****: P<0.0001). (D) Q-RT-PCR shows fold change of APTR (normalized to GAPDH), compared to the siGL2-transfected cells in the two cell lines in C (mean ±.e.m., n = 3). Note that cells were transfected on Day 1, so Day 2 is 1 day after transfection and Day 6 is 5 days after transfection. Thus si-APTR does not decrease APTR on day 1 after transfection, but the APTR RNA remains low up to day 5. (E) Schematic of MS2-CLIP. The dark line is APTR RNA fused to MS2 binding sequences. (F) APTR associates with the p21 promoter. Top: The % of input DNA present in the MS2BP-YFP CLIP is shown in cells expressing MS2 alone or MS2-APTR (mean ±s.e.m, n>6). 1–7 refer to the primer pairs in the schematic. Bottom: locations of p21 promoter fragments amplified by primer pairs 1–7 in the CLIP assay. Grey bar: area where APTR binds.

