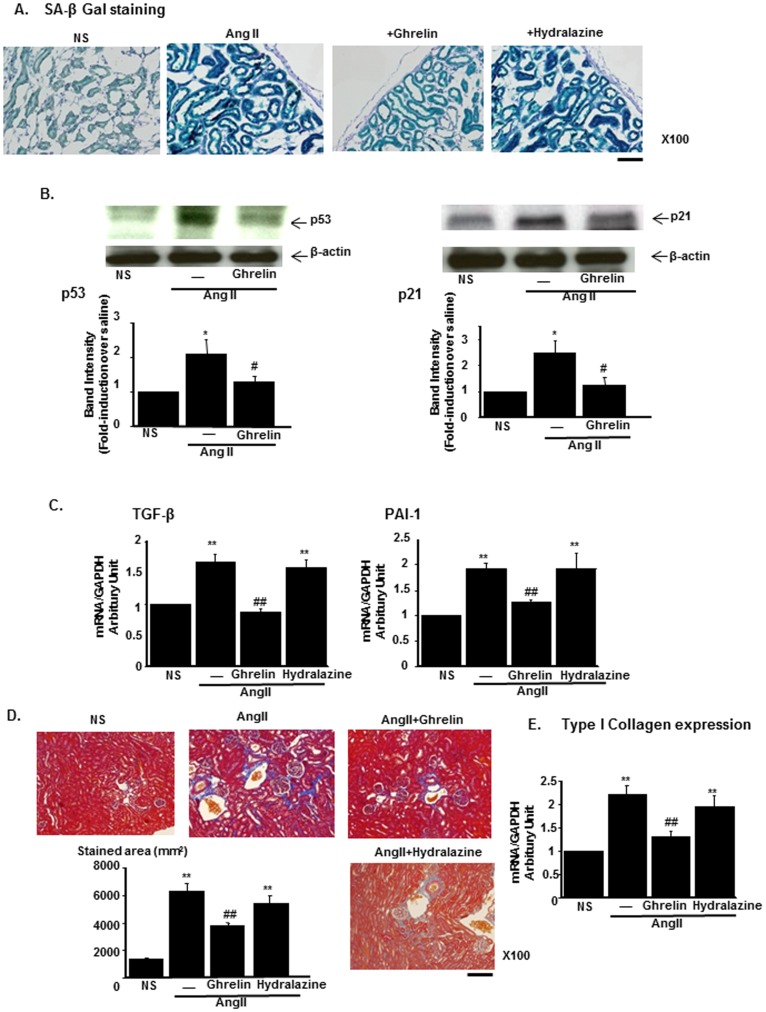
Figure 2. Amelioration of renal tissue senescent and fibrotic changes by Ghrelin in AngII-infused mice.
(A) Representative staining of senescence-associated β-Galactosidase (SA β-Gal). Scale bar, 100 µm. NS represents normal saline. (B) The protein expressions of p53 (left) and p21 (right) in saline-infused mice (NS), AngII-infused mice (AngII), and AngII-infused mice treated with Ghrelin. The representative immunoblotting (upper panel) and the results of densitometry analysis (lower panel) are shown. (C) The expression of TGF-β (left) and PAI-1 (right) mRNA in mice of each group. (D) The representative results of Masson-Trichrome staining of each experimental group. Bar graphs represent the quantification of fibrotic areas. Scale bar; 100 µm. (E) The mRNA expression levels of type I collagen in the kidney of each group. **p<0.01 vs. NS, *p<0.05 vs. NS, ##p<0.01 vs. AngII, #p<0.05 vs. AngII, n = 8.

