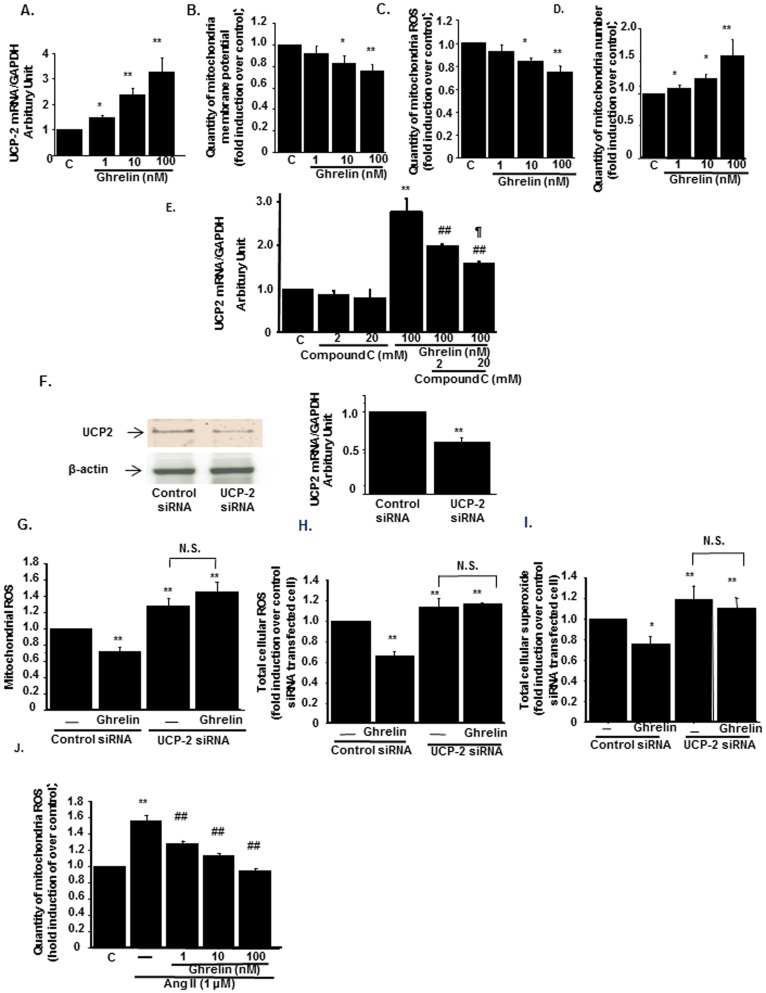
Figure 4. Mitochondria-derived ROS was reduced by Ghrelin through the induction of UCP2.
(A) The effects of Ghrelin on mitochondria-derived UCP2 mRNA levels. (B) Mitochondrial membrane potential was measured by the specific dye as described in Materials and Methods. **p<0.01 vs. control cells, n = 8. (C, D) The effects of Ghrelin on mitochondria-derived ROS levels (C) and mitochondria number (D) in HK-2 cells. **p<0.01 vs. control HK-2 cells, *p<0.05 vs. control, n = 8. (E) The effects of AMP-kinase inhibitor on Ghrelin-induced UCP2 upregulation. Compound C, AMP-kinase inhibitor at the concentrations of 2 and 20 µM was pretreated 30 minutes before the Ghrelin administration to HK-2 cells. **p<0.01 vs. control HK-2 cells, ##p<0.01 vs. HK-2 cells treated with 100 nM of Ghrelin, ¶p<0.05 vs. Ghrelin-treated cell with 2 µM of Compound C administration, n = 8. (F) Knock-down of UCP2 protein and mRNA were shown in the representative immunoblotting (left panel) and real-time PCR (right panel), respectively. **p<0.01 vs. control siRNA-transfected cells, n = 6. (G–I) Mitochondria-derived ROS (G), total cellular ROS (H), and total cellular superoxide (I) were measured after the transfection of UCP2 siRNA or control siRNA. HK-2 cells were transfected with siRNA and treated with or without 100 nM of Ghrelin **p<0.01 vs. control siRNA-transfected cells without Ghrelin. N.S. represents no significant difference. n = 8. (J) The effects of Ghrelin on AngII-induced Mitochondrial ROS production. HK-2 cells were treated with 1 nM, 10 nM, and 100 nM of Ghrelin 30 minutes before the treatment with 1 mM of AngII. respectively. **p<0.01 vs. control cells, *p<0.05 vs. control cells, ##p<0.01 vs. AngII-treated HK-2 cells, #p<0.05 vs. AngII-treated HK-2 cells, n = 8.

