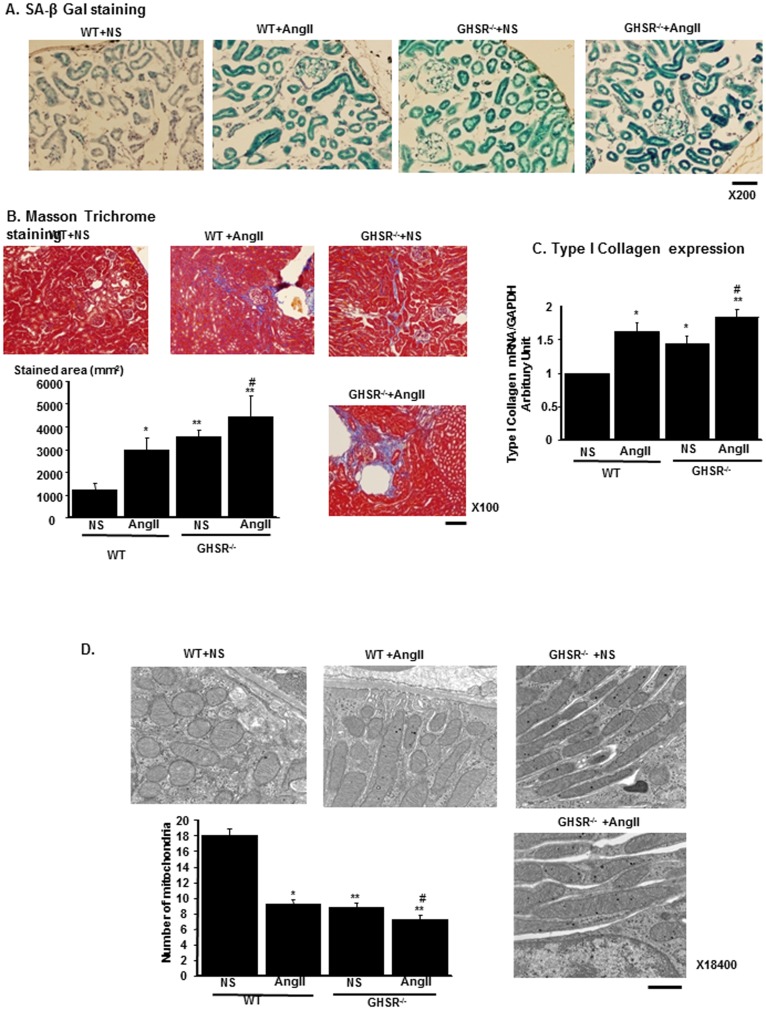
Figure 7. Tissue senescent, fibrotic changes and electromicroscopic findings in GHSR-null mice.
(A) Representative staining of senescence-associated β-Galactosidase (SA β-Gal) in WT wild type mice (WT) or GHSR-null mice (GHSR−/−) infused with normal saline (NS) or AngII. Scale bar, 50 µm. (B) The representative results of Masson-Trichrome staining of each experimental group. Bar graphs represent the quantification of fibrotic areas. Scale bar, 100 µm. (C) The mRNA expression levels of type I collagen of each experimental group. (D) Electron microscopic findings of mitochondria show that the number of mitochondria was reduced and that morphology of mitochondria was altered in GHSR-null mice (GHSR−/−) with NS in comparison to that in WT+NS. Bar graph represents the result of number of mitochondria in the field of electron microscope in each mice group. Scale bar; 1 µm. **p<0.01 vs. WT+NS, *p<0.05 vs. WT+NS, #p<0.01 vs. GHSR−/−+NS, n = 6.

