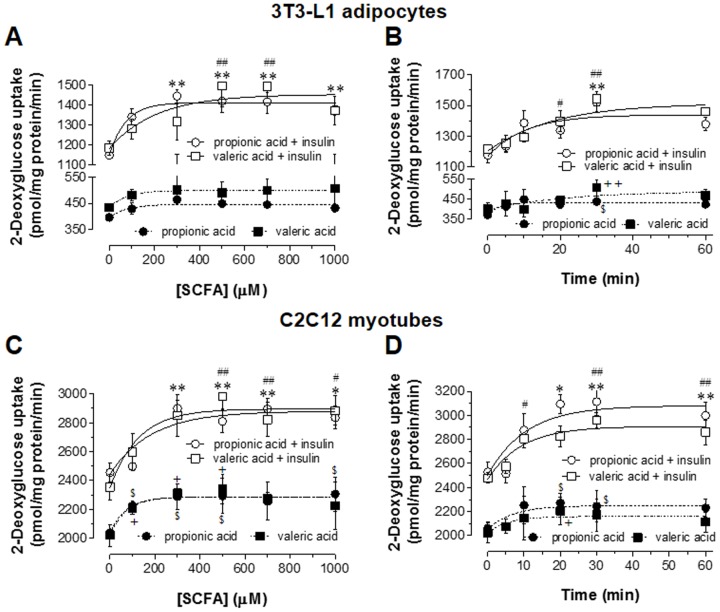
Figure 3. Dose-response relationship between SCFAs and glucose uptake in 3T3-L1 adipocytes and C2C12 myotubes, and time-course analysis.
For the determination of dose-response relationship, 3T3-L1 adipocytes (A) or C2C12 myotubes (C) were starved and treated with various concentrations of propionic acid or valeric acid for 30 min in the absence or presence of insulin (100 nM) in KRPH buffer. For the analysis of time-course, 3T3-L1 adipocytes (B) and C2C12 myotubes (D) were treated with 300 µM propionic acid or 500 µM valeric acid for the indicated time in the absence or presence of insulin in KRPH buffer. After adding 2-deoxy-[3H]-glucose for 10 min, glucose uptake was measured in the cell lysates as described in the Methods. Results are the means ± SEM of three similar independent experiments, each performed in quadruplicate. *P<0.05 and **P<0.01 for propionic acid, and # P<0.05 and ## P<0.01 for valeric acid, vs. insulin-stimulated glucose uptake with no SCFA treatment. $ P<0.05 for propionic acid, + P<0.05 and ++ P<0.01 for valeric acid, vs. basal glucose uptake with no SCFA treatment.

