Figure 8.
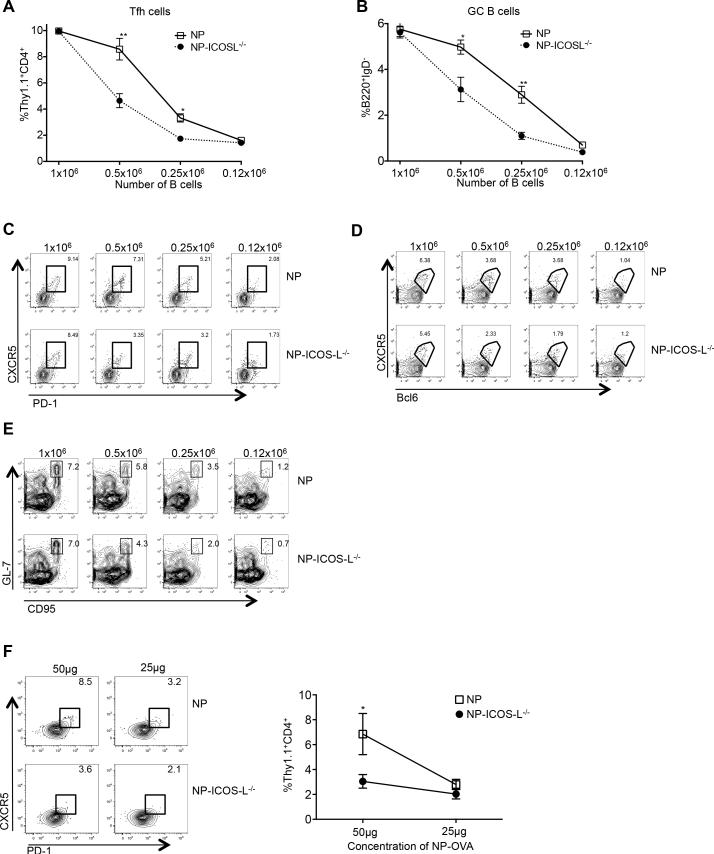
ICOS-L on B cells is required for Tfh-cell development and GC responses when Ag-presenting B cells or Ag are limited. (A) CD19−/− mice received 1 × 10⁶, 0.5 × 10⁶, 0.25 × 10⁶ or 0.12 × 10⁶ NP-specific or NP-specific ICOS-L−/− B cells co-transferred with 0.5 × 10⁶ CD4+ Thy1.1+ OT-II T cells, with spleens of recipients harvested 7 days after immunization with NP-OVA. Percentages of CD4+ Thy1.1+ CD44+ CXCR5hi PD-1hi T and B220+ IgD− GL-7hi CD95hi B cells from animals receiving various numbers of NP-specific B cells are shown. (C-E) Representative flow cytometry plots of splenic CD4+ Thy1.1+ OT-II CD44+CXCR5hiPD-1hi or CD4+Thy1.1+CD44+CXCR5hiBcl6hi T cells, or B220+IgDloGL-7hiCD95hi B cells. Experiments were performed 3 times with n ≥ 5 per group. (F) CD4+ Thy1.1+ OT-II cells were transferred into CD19-deficient mice, followed by immunization with 100 μg NP-OVA. Two days after priming, 0.05 × 10⁶ OT-II T cells were re-transferred, along with 1 × 10⁶ ICOS-L-intact or –deficient NP-specific B cells, into CD19−/− animals primed 2 days earlier with 25 or 50 ug of NP-OVA, with spleens of recipients harvested 7 days after immunization. Representative flow cytometry plots of splenic CD4+ Thy1.1+ OT-II CD44+CXCR5hiPD-1hi Tfh cells with the percentages of such cells among CD4+ Thy1.1+ cells shown on the graph on the right. n = 3 mice per group. **p < 0.003; *p < 0.02 by Sidak's multiple comparison test comparing the means of Tfh (A and F) and GC B (B) cell percentages (of transferred cells) in recipient mice. Error bars represent standard deviation.

