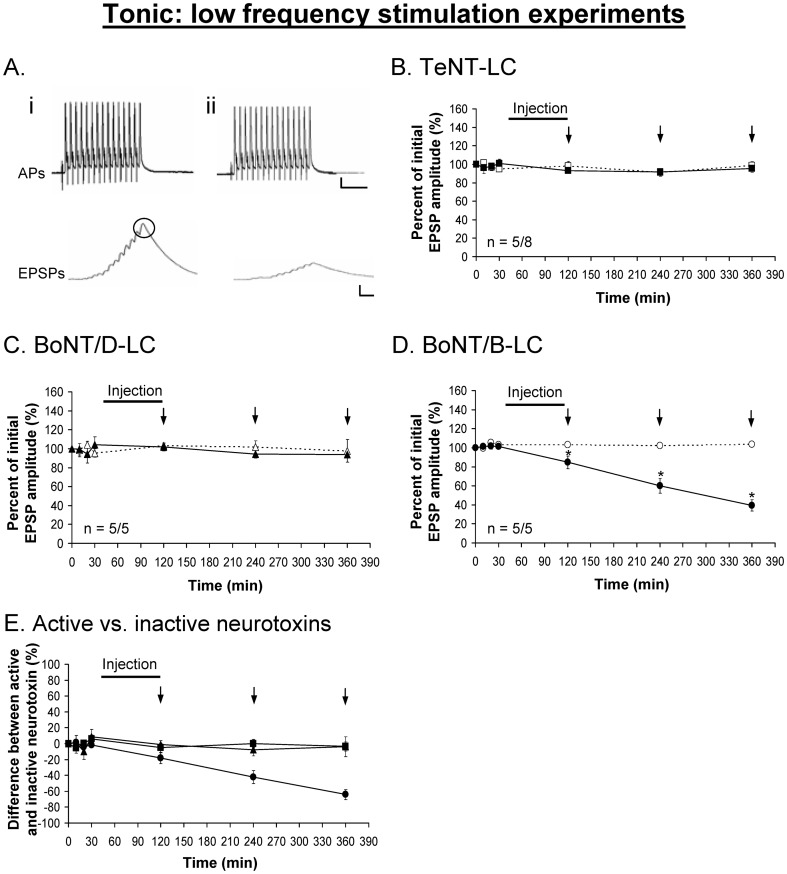
Figure 4. Tonic EPSPs are inhibited using BoNT/B-LC under low frequency stimulation.
A, Example showing the tonic action potentials (APs, 200 Hz) remain unchanged before (i) and after (ii) the injection of each neurotoxin (BoNT/B-LC used as the example). TeNT-LC (B) and BoNT/D-LC (C) did not have an effect on the tonic evoked response. E, Percent difference between active and inactive neurotoxin, in which the inactive neurotoxin is the reference point at 0%. In B-E, a solid black line represents the time course of neurotoxin injection (90 min) and vertical arrows (↓) represent when EPSPs were recorded. Active neurotoxins: TeNT-LC (▪), BoNT/D-LC (▴) and BoNT/B-LC (•). Inactive neurotoxins: TeNT-LC (□), BoNT/D-LC (△) and BoNT/B-LC (○). Error bars represent S.E.M. The measured tonic (last) EPSP is encircled in black (Ai). An asterisk (*) denotes a significant difference (p<0.05) and ‘n’ represents the sample size (active/inactive neurotoxin). Scale bars: horizontal – 10 ms; vertical – 10 mV (APs), 5 mV (EPSPs).

