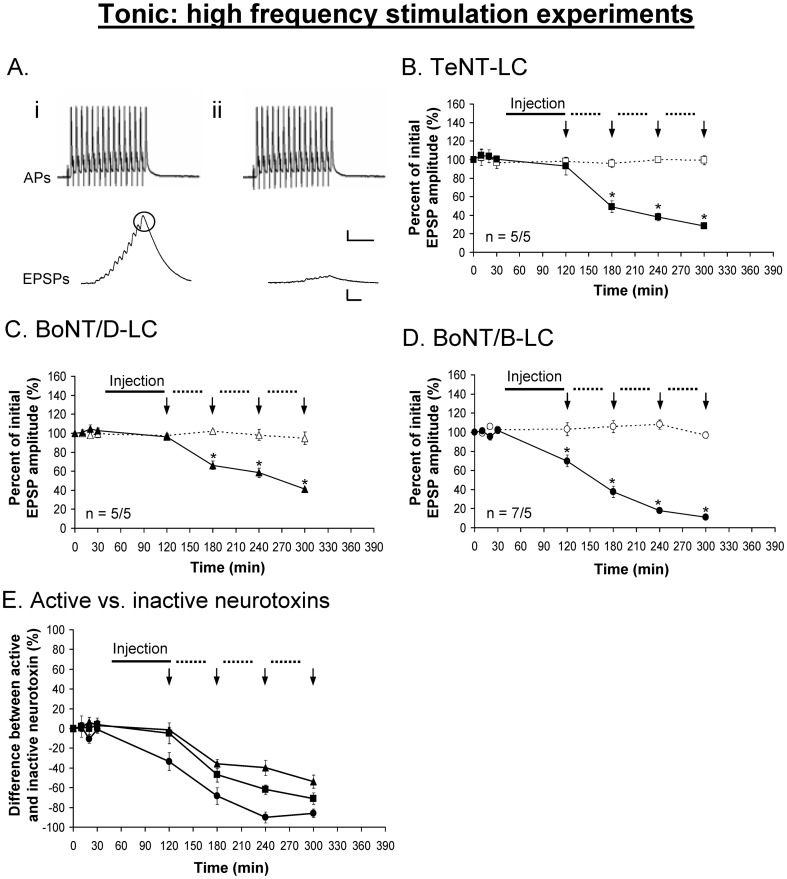
Figure 7. Tonic EPSPs are inhibited using TeNT-LC (B), BoNT/D-LC (C) and BoNT/B-LC (D) under high frequency stimulation.
A, Example showing the tonic action potentials (APs) remain unchanged before (i) and after (ii) the injection of each neurotoxin (BoNT/B-LC used as the example). E, Percent difference between active and inactive neurotoxin, in which the inactive neurotoxin is the reference point at 0%. In B-E, a solid black line represents the time course of neurotoxin injection (90 min), the dotted lines represent the time course of each round of high frequency stimulation (40 min) and vertical arrows (↓) represent when EPSPs were recorded. Active neurotoxins: TeNT-LC (▪), BoNT/D-LC (▴) and BoNT/B-LC (•). Inactive neurotoxins: TeNT-LC (□), BoNT/D-LC (△) and BoNT/B-LC (○). Error bars represent S.E.M. The measured tonic (last) EPSP is encircled in black. An asterisk (*) denotes a significant difference (p<0.05) and ‘n’ represents sample size (active/inactive neurotoxin). Scale bars: horizontal – 10 ms; vertical – 10 mV (AP), 5 mV (EPSP).

