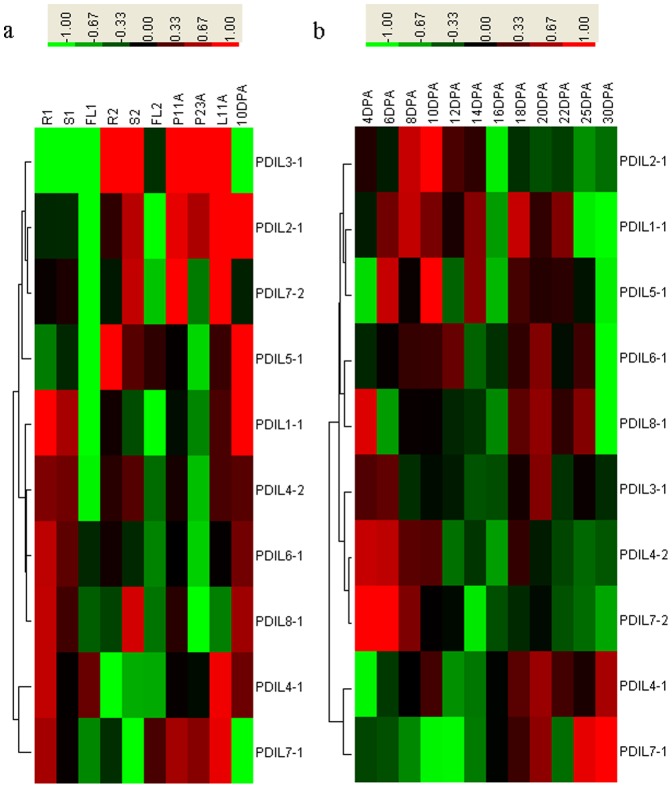
Figure 6. Expression profiling of PDI and PDIL genes in different Brachypodium distachyon organs.
(a) Comparative expression levels of 10 PDI and PDI-like genes in different Brachypodium distachyon organs, including roots (R1), stems (S1), and flag leaves (FL1) at the two-leaf stage, stem (S2) and flag leaf (FL2) at heading with 1 cm section of panicle from the leaf sheath; seed palea at 11 and 23 days after anthesis (P11A and P23A); seed lemma at 11 days after anthesis (L11A), and caryopses at 10 days post-anthesis (10 DPA). (b) Dynamic expression profiles of 10 PDI and PDI-like genes during seed development in Bd21. Relative quantification of the expression levels in developing caryopses was collected between 4 and 30 DPA. Expression data were obtained from three biological replicates. The relative expression levels at 10 DAP were set to value 1 as the calibrator in the pictures a and b.

