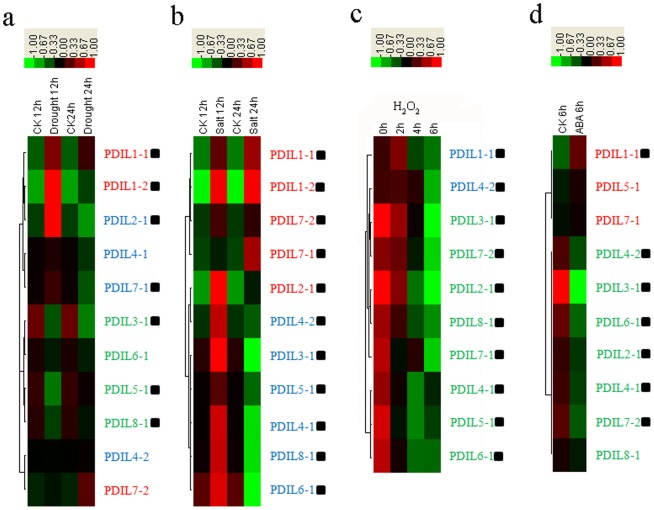
Figure 7. Expression profiles of BdPDI family members in the leaves of B. distachyon in response to drought, salt, H2O2 and ABA, treatments using real-time quantitative RT-PCR and Cluster 3.0 and Java Tree View programs.
Blocks with colors indicated decreased (green) or increased (red) transcript accumulation relative to the respective control. The gene expression patterns were labeled in red (up-regulated), green (down-regulated), and blue (up- or down-regulated in different times). Filled squares indicated a significant difference from the control (P<0.05) using SPSS (Statistical Product and Service Solutions) software. Expression profiles of the BdPDI and PDIL genes under: a. drought stress for 12 h and 24 h; b. salinity stress for 12 h and 24 h; c. H2O2 stress for 0, 2, 4 and 6 h; d. ABA stress for 6 h.

