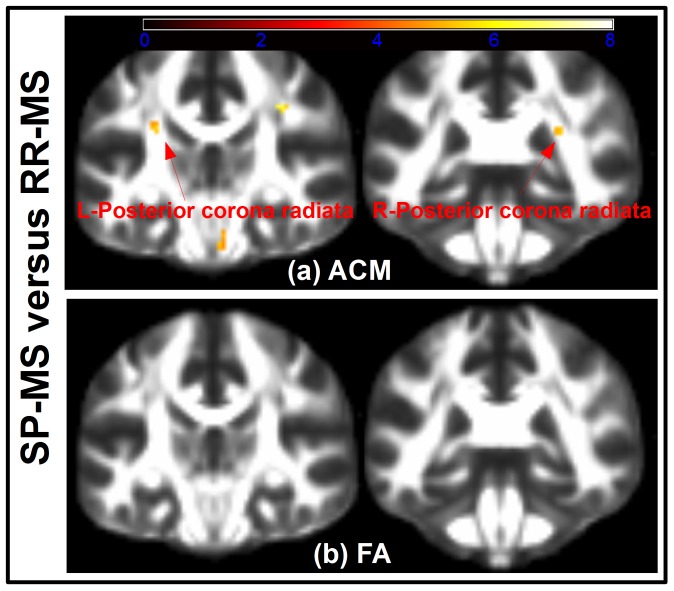
Figure 4. Voxelwise comparison between the phenotypes of RR-MS and SP-MS.
(a) Shows t-test voxels, thresholded at SVC significance level of 0.05. The coronal slices show where the SP-MS patients have significantly reduced ACM compared to RR-MS patients. The voxel-based t-tests reveal significant reductions at the left posterior corona radiata (coronal slice 46, shown on the left) and the right posterior corona radiata (coronal slice 52, shown on the right). The embedded arrows points to the regions of significant voxels. Similarly, (b) shows the result of testing where the SP-MS patients have a decreased FA compared to the RR-MS patients and no significant voxels are found. The t-tests depicted in (a) and (b) have been overlaid the FMRIB58_FA atlas.

