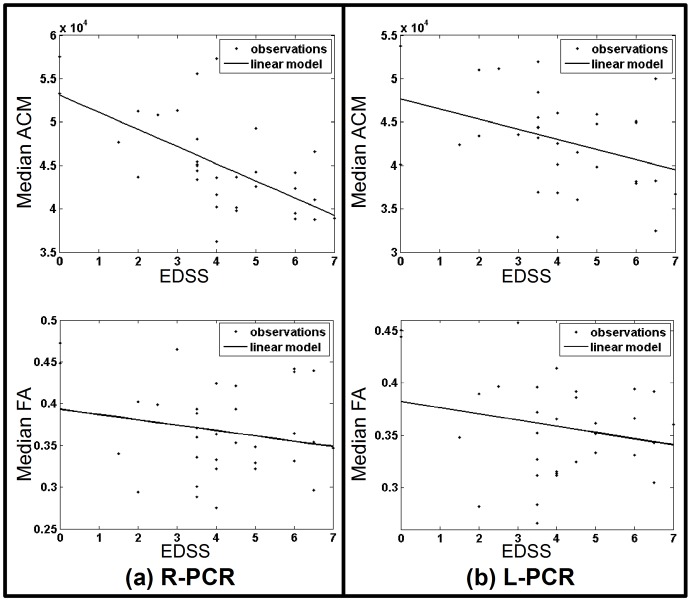
Figure 5. Disease score correlations.
Shows the median ACM and the median FA plotted against EDSS disease score where the ACM and FA indices are sampled from a specific WM region of the JHU-ICBM-DTI-81 atlas. Subfigure (a) shows a cross subject plot of the median ACM and the median FA summary statistics obtained from the right posterior corona radiate (R-PCR). The data points are depicted with dots while a general linear model (GLM) fit is shown as a solid line. Similarly, (b) shows the median ACM and median FA plots based on the left posterior corona radiate (L-PCR).

