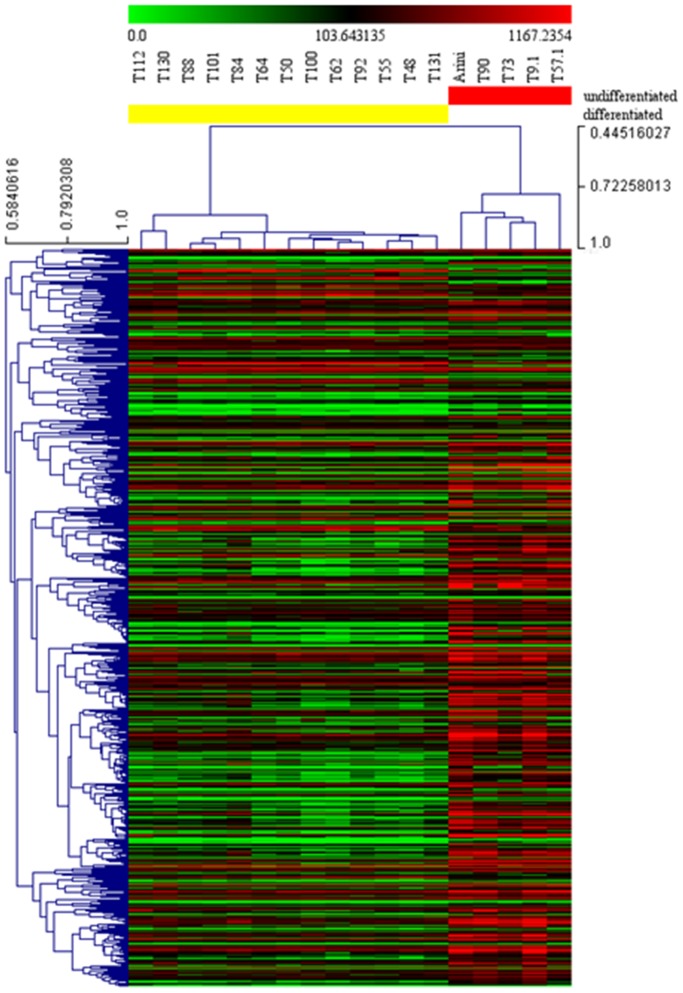
Figure 1. Hierarchical clustering and heat map of differentiated and undifferentiated reference samples.
Hierarchical clustering was performed using gene expression data of 597 differentially expressed genes obtained through the comparison of reference samples (13 differentiated and 5 undifferentiated mast cell tumors) with SAM, fixing a fold change of 2 as well as a False Discovery Rate of 0.01 as parameters. Red and green indicates up- and down-regulated genes relative to the mean expression in all samples, respectively. Samples were hierarchically clustered into differentiated (left, yellow) and undifferentiated (right, red) and based on the Pearson correlation coefficients and average linkage clustering. Genes were hierarchically clustered based on Pearson correlation coefficients and average linkage clustering. Units of the bar legend: absolute values.

