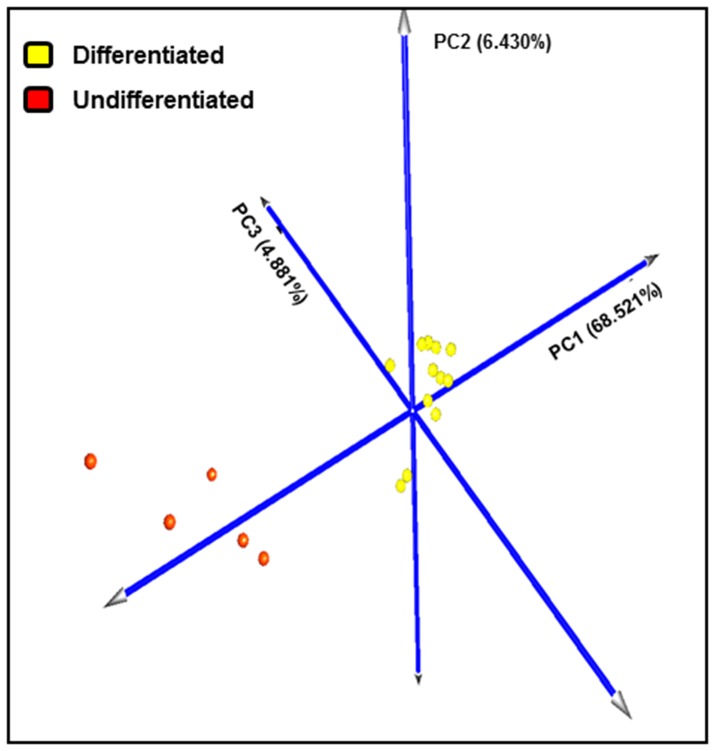
Figure 2. Principal component analysis of differentiated and undifferentiated reference samples.
Analysis was performed using gene expression data of 597 differentially expressed genes obtained through the comparison of reference samples (13 differentiated and 5 undifferentiated mast cell tumors) with SAM, fixing a fold change of 2 as well as a False Discovery Rate of 0.01 as parameters. Each colored sphere corresponds to a reference sample (differentiated mast cell tumors are indicated in yellow, while undifferentiated ones in red). The value of each principal component is reported on the graph. The sum of the three principal components accounted to the 79.883% of the total variance.

