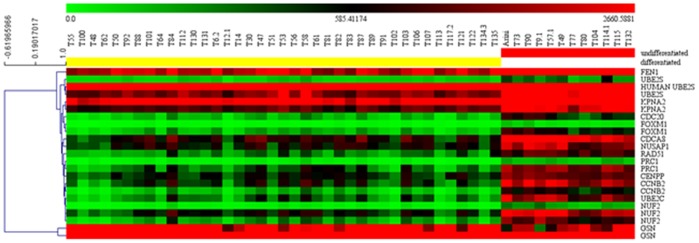
Figure 4. Gene expression profiling of marker genes in differentiated and undifferentiated MCT samples.

Heat map and hierarchical clustering of all samples analyzed by DNA microarray using probes referable to the transcripts identified by class prediction analysis. Red indicates up-regulated and green down-regulated genes relative to the mean expression in all samples. For display purposes, samples in each class (differentiated and undifferentiated) were clustered separately and arranged from differentiated (left, yellow) to undifferentiated (right, red). Genes were hierarchically clustered separately based on the Pearson correlation coefficients and average linkage clustering. Units of the bar legend: absolute values.
