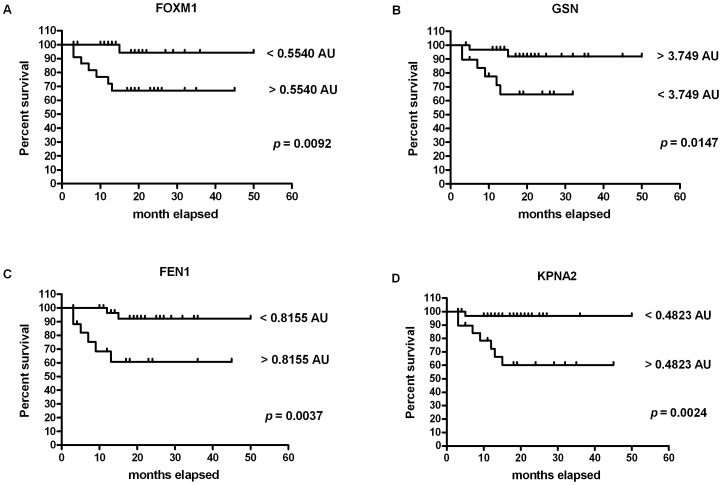
Figure 7. Survival curves for mortality due to mast cell tumor, stratified by marker gene mRNA expression cut point.
(A) FOXM1. The cut-off chosen was 0.5540 AU (FOXM1<0.5540 AU: n = 28; FOXM1>0.5540 AU: n = 23). (B) GSN. The cut-off chosen was 3.749 AU (GSN >3.749: n = 31; GSN <3.749 AU: n = 20). (C) FEN1. The cut-off chosen was 0.8155 AU (FEN1<0.8155 AU: n = 33; FEN1>0.8155 AU: n = 18). (D) KPNA2. The cut-off chosen was 0.4823 AU (KPNA2<0.4823 AU: n = 31; KPNA2>0.4823 AU: n = 20).

