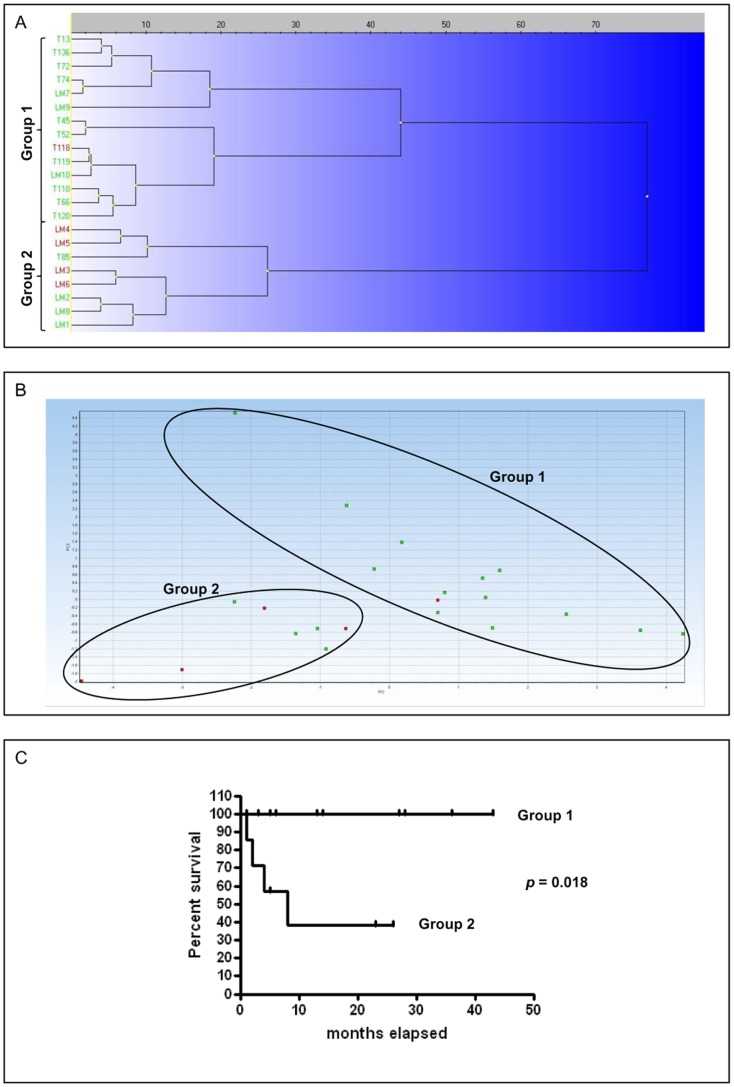
Figure 8. qPCR confirmatory analysis.
Marker genes identified by class prediction analysis were amplified in an independent cohort of 22 mast cell tumors in order to comprehend their utility for mast cell tumor classification. Clustering analysis and PCA of gene expression data were performed using MultiD-Genex software for qPCR data, using the following settings: mean center scaling, Ward’s algorithm and Manhattan distance. (A) Clustering tree and (B) principal component analysis of independent mast cell tumor samples. Cases characterized by MCT-related death are indicated in red. The two groups identified are named group 1 and 2 (differentiated and undifferentiated MCTs, respectively). (C) Kaplan-Meyer survival plot stratified by molecular classification (group 1 and 2).

