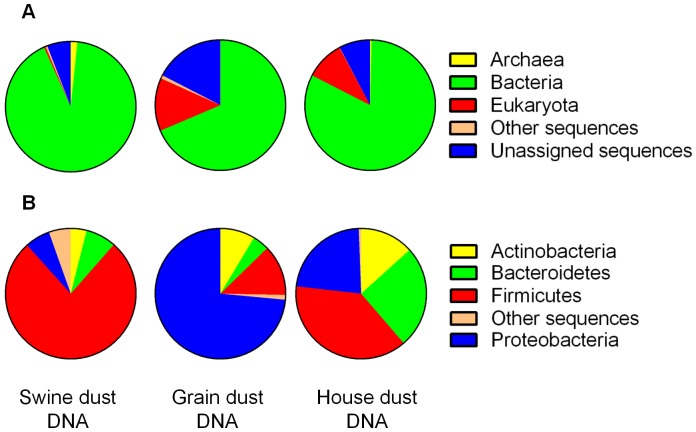
Figure 3. Taxonomic classification of metagenomic reads from swine confinement facility dust, grain elevator dust and household dust without pets.
A. Domain level; B. Phylum level. Each pie chart represents relative abundance values expressed as the total number domains (“pre-filtered” dataset) or phyla (“filtered” dataset) from swine confinement facility dust, grain elevator dust and household dust without pets. Other sequences equals reads that align significantly to the M5NR database that are derived from taxa not listed as descendants from one of the domains; Unassigned equal reads that do not align significantly to any M5NR database sequence.

