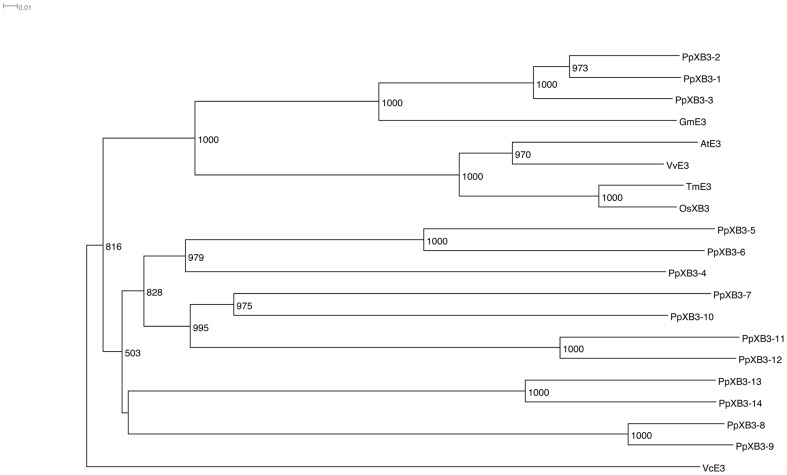
Figure 6. Phylogenetic analysis of PpXB3s and E3 proteins of other plants.
Sequence names correspond to E3 protein sequences listed in Table S4. Phylogenetic trees were constructed by the neighbor-joining method. Numbers at the nodes indicate bootstrap values from 1,000 replicates.

