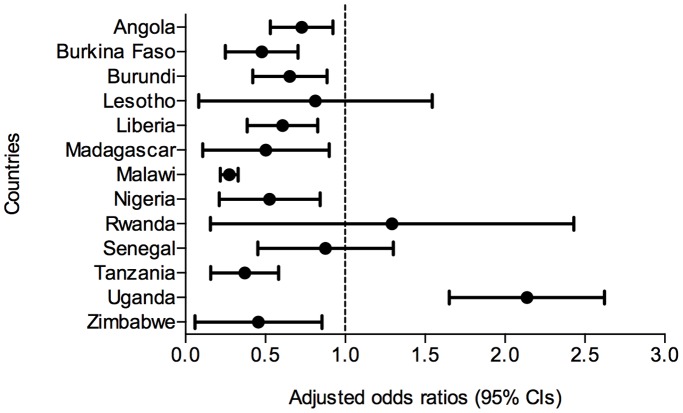
Figure 2. Forest plot of test uptake at non-hospital sources versus hospitals in each country.
Figure legend: CI refers to confidence interval. Mixed-effects logistic regression models adjusted for data clustering and Table 3 covariates. AOR <1.0 indicates reduced odds of testing at non-hospital sources compared to hospitals.

