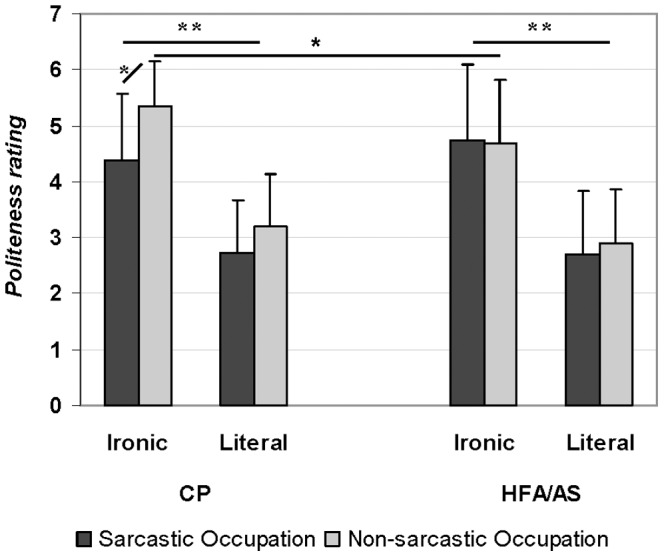
Figure 4. Politeness ratings (1 = not at all polite and 7 = extremely polite) of the speaker statement by the two participant groups as a function of the statement (Ironic and Literal) and of the occupation (Sarcastic and Non-sarcastic).

Error bars are standard deviations. * = p<.05; ** = p<.0001.
