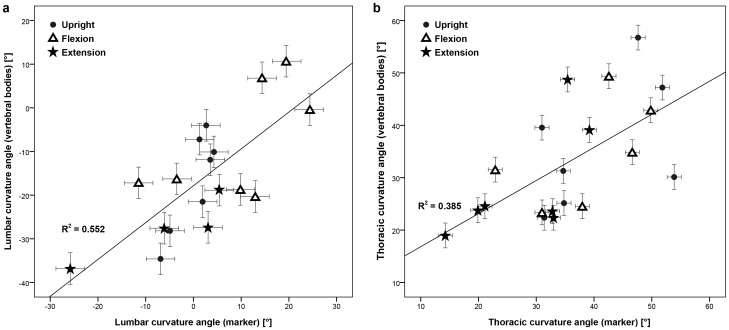
Figure 3. Scatter diagram of the lumbar (a) and thoracic curvature angle (b) in the upright (circle), flexed (triangle) and extended positions (star).
The x-axis represents the values calculated from the markers, and the y-axis from the vertebral bodies. The crosses show the open MRI's measurement uncertainty of the curvature angles calculated from the markers (x-axis) and calculated from the vertebral bodies (y-axis).

