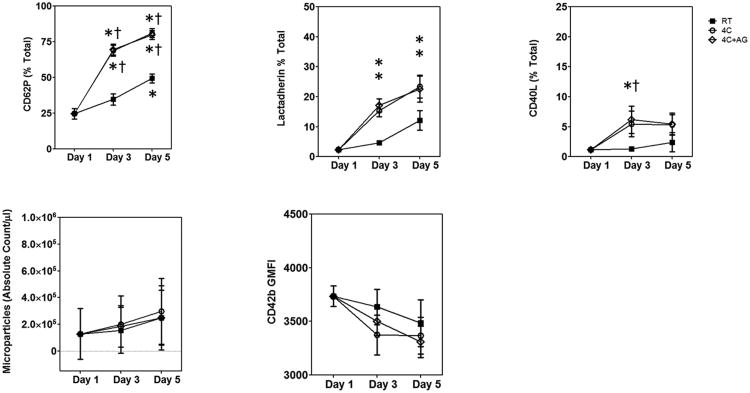
Figure 3.
Estimation of surface receptor levels by flow cytometry. (A) P-Selectin; (B) lactadherin binding (PS exposure); (C) CD40L expression; (D) Microparticle release; and (E) GP Ibα. Treatment conditions are represented as follows: RT =
 ; 4C =
 ; 4C+AG =
 . The expression levels are represented as mean±SEM. Differences from Baseline (*) and between treatment groups (†) are shown if results from both the one-way ANOVA for repeated measures and the post-hoc Bonferroni test comparisons are significant (P<0.05).

