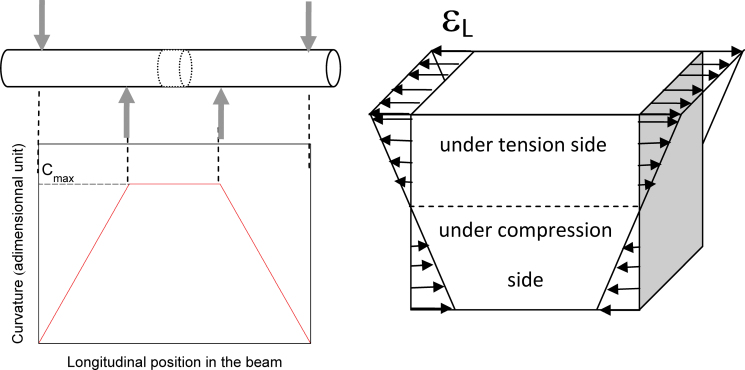
Fig. 2.
Theoretical profile of curvature along the beam and internal strain distribution in a beam section during a bending test. The longitudinal strain εL is maximum at the upper (positive values) and lower faces (negative values). Grey arrows indicate the positions of the four bending points. (This figure is available in colour at JXB online.)

