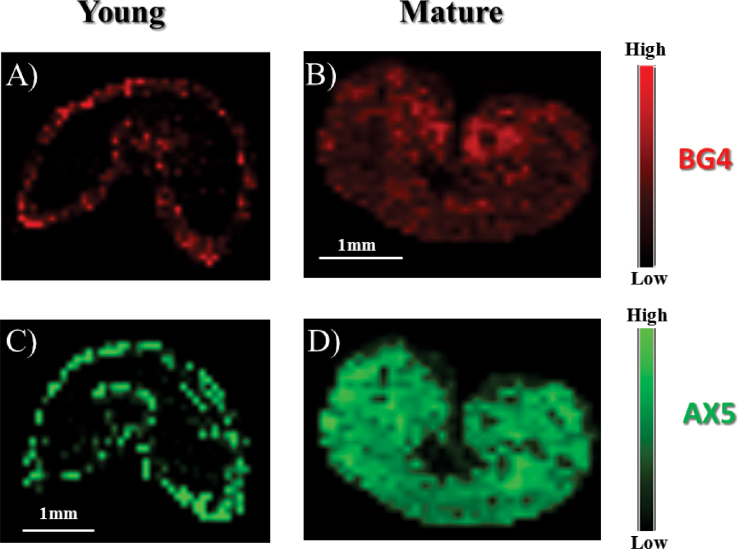
Fig. 3.
Distribution of β-glucan 4 (BG4, ion at 689 m/z; A and B) and arabinoxylan 5 (AX5, ion at 701 m/z; C and D) released following the on-tissue enzymic digestion of young (A and C) and mature (B and D) wheat sections. Note that the scales indicate the relative signal intensity within a section but cannot be used to compare the intensities between different sections.

