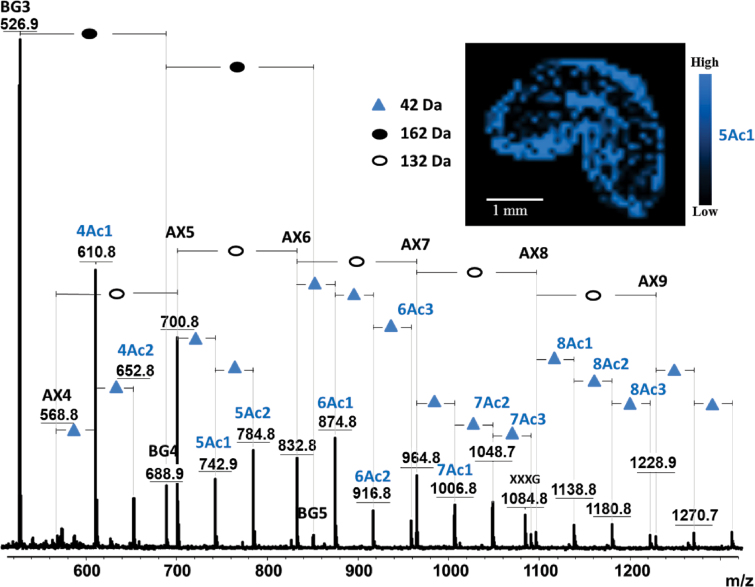
Fig. 6.
Average mass spectrum of young wheat sections following in situ enzymic digestion using lichenase and xylanase. The insert shows the distribution of the ions at 743 m/z (mono-acetylated AX5, 5Ac1) across the tissue section. AX, arabinoxylan oligomer; BG, β-glucan oligomer; numbers after BG and AX indicate the degree of polymerization of the oligomers; Ac indicates the presence of acetylation on AX; numbers before Ac indicate the degree of polymerization of AX acetylation; numbers after Ac indicate the degree of acetylation at the corresponding AX oligomer; XXXG, xyloglucan heptasaccharide, used as internal standard.

