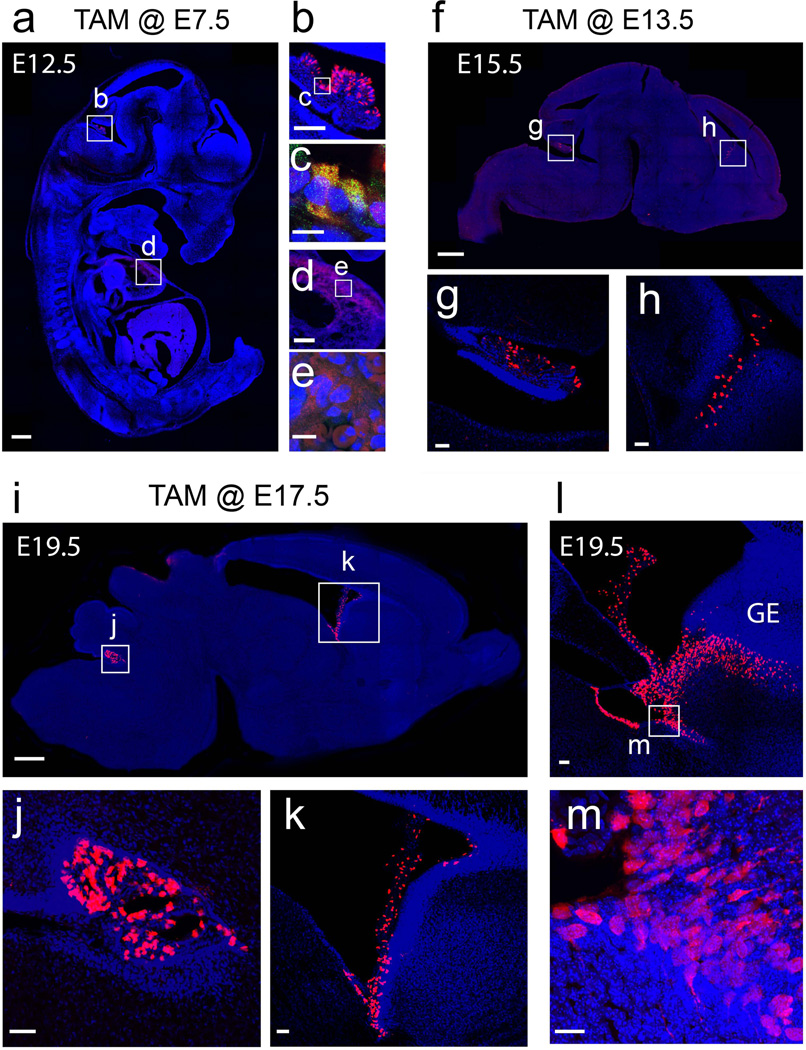
Figure 2. Induction of recombination in Foxj1CreERT2::GFP embryos.
(a–e) TAM administration during early embryonic stages E7.5 to E12.5 reveals clear recombination in discrete areas in a sagittal section of the whole embryo (a). (b) Higher zoom of boxed region in (a) showing tdTom+ cells in the choroid plexus. (c) High power image of boxed region in (b) reveals tdTom+ cells in the choroid colocalized with the GFP::Cre::ERT2 signal. (d) Higher zoom of boxed region in (a) showing that the dim tdTom+ signal in the thorax of the embryos is diffuse and surrounded by autofluorescing red blood cells within the dorsal cardiac tissue. (e) GFP::Cre::ERT2 signal was not detectable in the tdTom+ cells in the heart. (f–h) TAM inductions at E13.5 to E15.5 reveal tdTom+ cells in the choroid plexus as shown in a sagittal section of the brain (f). (g–h) Boxed regions in (f) showing tdTom+ cells in the choroid plexus of the fourth (g) and lateral (h) ventricles. (i–m) TAM inductions at E17.5 and analyzed at E19.5 reveals tdTom+ cells in the choroid plexus as well as in developing ependymal cells in the ventricular walls in a sagittal section of the brain (i). (j–k) Boxed areas in (i) exhibiting tdTom+ cells in the fourth (j) and lateral (k) ventricles. (l) Zoomed view of the lateral ventricles surrounding the ganglionic eminence (GE) in a sagittal section close to midline. (m) High power image boxed area in (l) shows tdTom+ cells clearly within the ventricular zone of the GE. Blue: DAPI nuclear staining in all images. Scale bars: 500µm in (a), (f), and (i); 200 µm in (d); 100µm in (b); 50µm in (g), (h), (j), (k), and (l); 20µm in (m); 10µm in (c) and (e).

