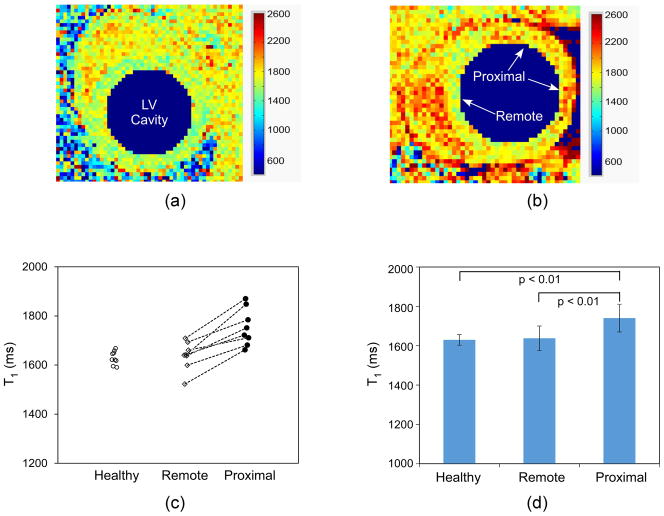
Fig. 4.
Representative baseline myocardial T1 before contrast agent injection. Myocardial T1 map of (a) a healthy rat showed uniform T1 value throughout the left ventricle (LV) myocardium; (b) whereas, myocardial T1 map of a rat with acute MI revealed regional higher T1 in the proximal area of ligation (anterior-lateral and lateral myocardium), probably because of edema occurred right after the ligation; The blood T1 in the LV cavity was deliberately suppressed to better demonstrate the LV myocardium contour. (c) Plot of each individual baseline myocardial T1 values of the eight measurements in healthy rats, and in the remote and proximal regions towards LAD ligation in the eight rats with acute MI; (d) The mean baseline myocardial T1 values and their SD in the healthy rats, and in the remote and proximal regions of the rats with ligation. T1 in the proximal regions supplied by the ligated arteries was significantly different from that in the remote area of the same rat, and from the one in healthy rat.

