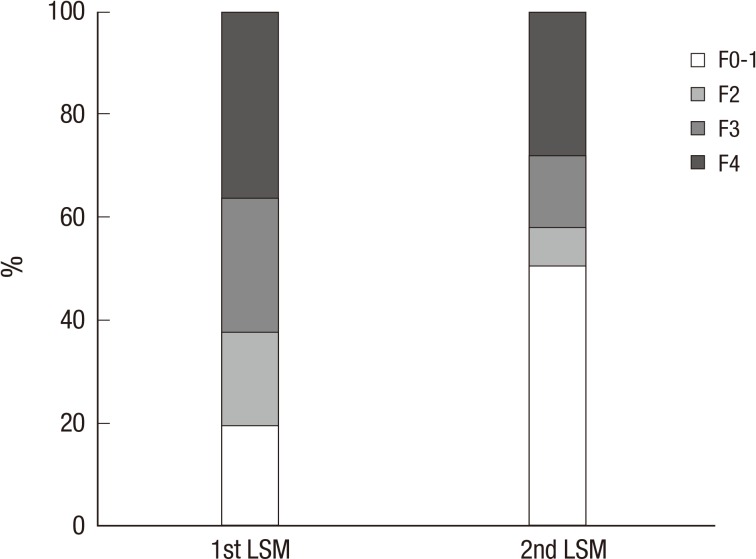
Fig. 2.
Changes of the proportion of the patients grouped by the fibrosis stage between two liver stiffness measurements during oral antiviral therapy. The patients' initial fibrosis stages were 16 (19.3%) in F0-1, 15 (18.1%) in F2, 22 (26.5%) in F3 and 30 (36.1%) in F4, respectively. After antiviral therapy, the patients' fibrosis stages were 42 (50.6%) in F0-1, 6 (7.2%) in F2, 12 (14.5%) in F3 and 23 (27.7%) in F4, respectively.

