
Table 4.
Comparison of groups by fibrosis stage improvement during antiviral therapy
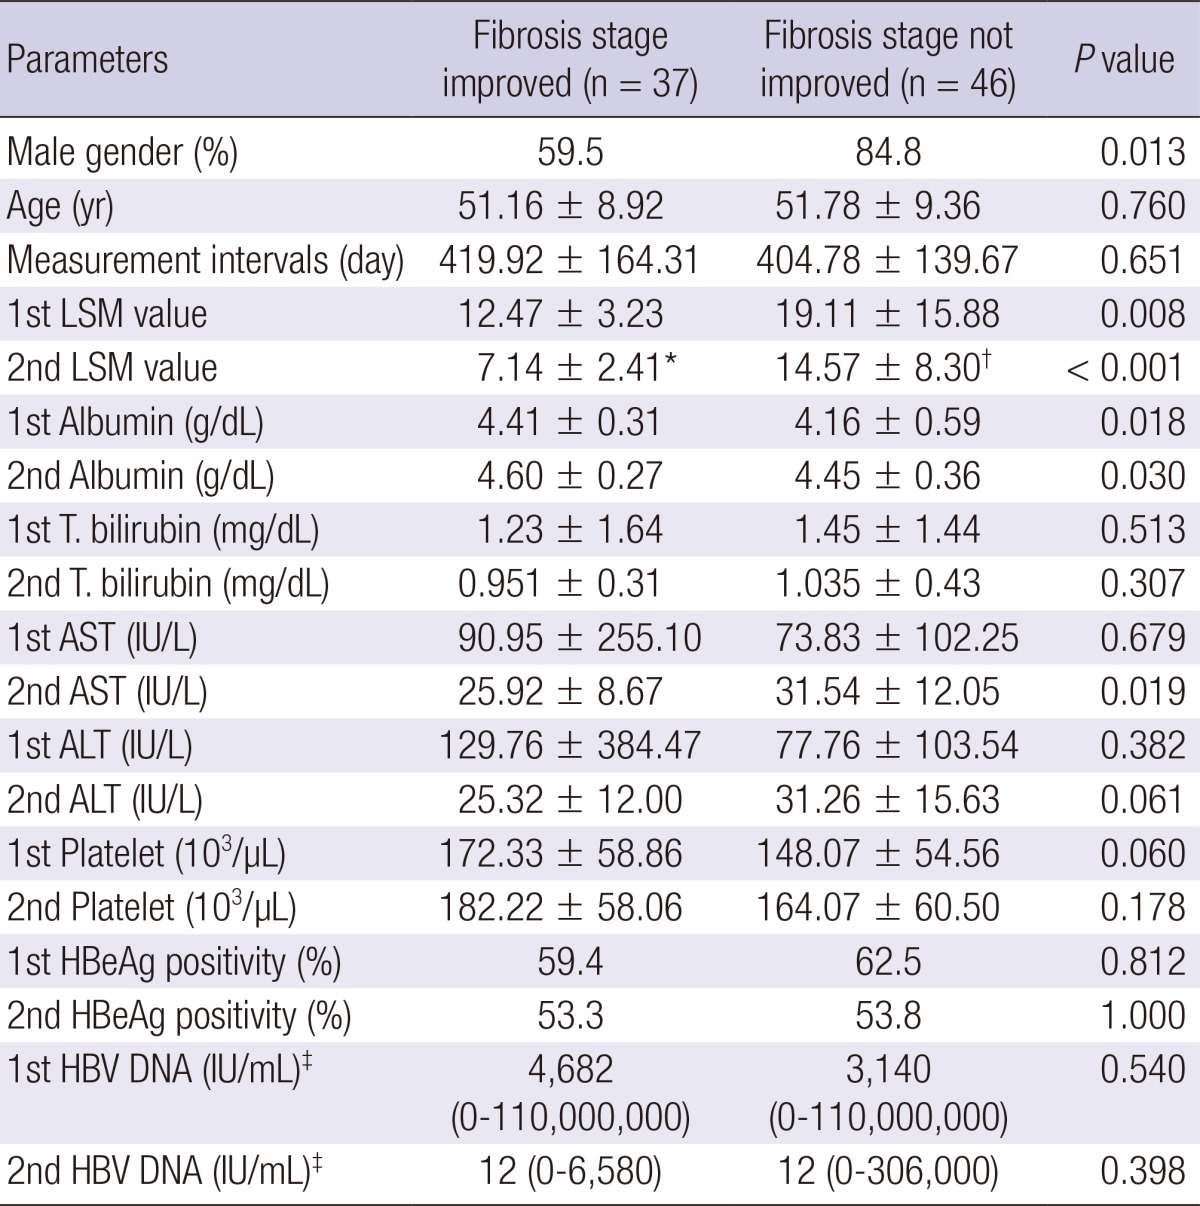
*P < 0.001; †0.011 compared to 1st LSM values; ‡Median. AST, aspartate aminotransferase; ALT, alanine aminotransferase; LSM, liver stiffness measurement; HBeAg, hepatitis B envelop antigen; HBV, hepatitis B virus.