Figure 2.

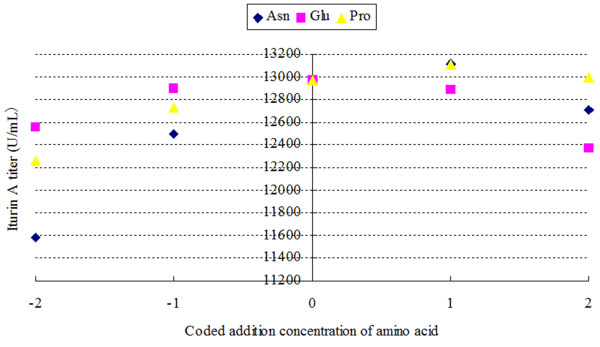
Sensitivity analysis of ANN model using perturb method. It indicated the effects of each independent variable when changing in the entire optimized range. The coded values were shown in Table 5.

Sensitivity analysis of ANN model using perturb method. It indicated the effects of each independent variable when changing in the entire optimized range. The coded values were shown in Table 5.