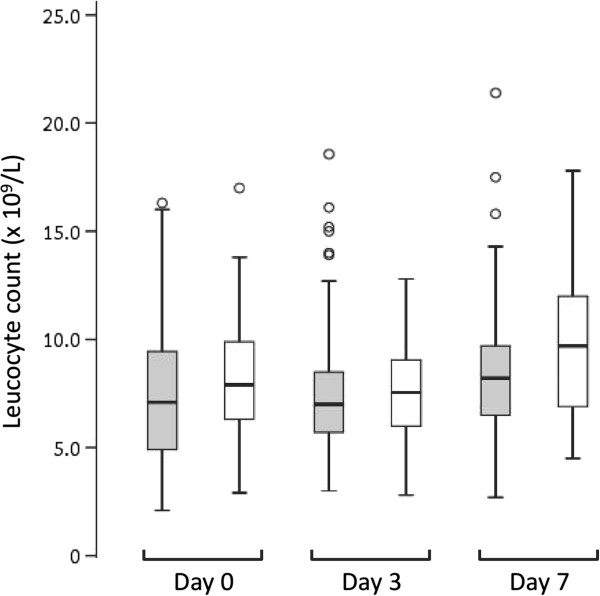
Figure 1.
Box plot showing median, interquartile range, minimum and maximum leucocyte counts in children with falciparum monoinfection (grey boxes) compared to those with vivax monoinfection (white boxes) during the one-week follow-up period. Outlying values are shown as open circles. There were no significant differences between the two groups on Days 0, 3 and 7 (P = 0.18, 0.34 and 0.051, respectively).

