
Figure 3.
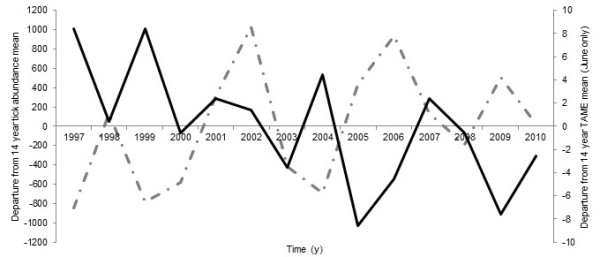
Time series plot of departures from a 14-year average of nymphal blacklegged tick abundance and June TAMEs recorded for Rhode Island, 1997–2010. Dashed line represents departure from a 14-year tick abundance mean. Solid line represents departure from a 14 year average of June TAMEs.