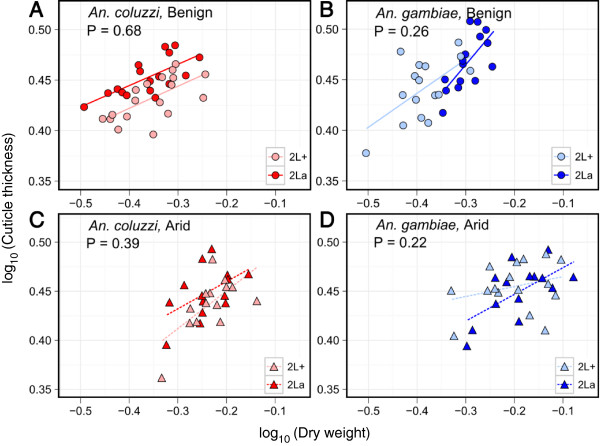
Figure 3.
Log-log relationships of cuticle thickness (μm) versus total body dry weight (mg) for two species under two environmental regimens. Plots (A, B) illustrate An. coluzzii and An. gambiae under benign conditions; plots (C, D) illustrate these species under arid conditions. Each data point (circles and triangles for benign and arid conditions, respectively) represents an individual adult female. P-values in each plot indicate that the slopes of the regression lines do not differ significantly between alternative homokaryotypes (2La versus 2L+a, represented by dark versus light shaded lines and symbols) of the same species in the same environment.

