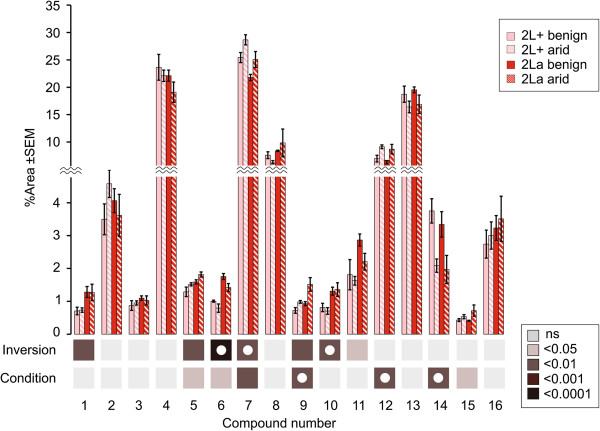
Figure 6.
Mean relative abundance (±SE) of the 16 cuticular hydrocarbons of An. coluzzii SUCAM detected for each karyotype and environmental condition. Beneath the bar chart, two rows of squares indicate the statistical significance of comparisons based on karyotype (2La versus 2L+a; “Inversion”) and environmental condition (arid versus benign; “Condition”). Squares are color coded according to level of significance; those with white circles represent P-values that remain significant following Bonferroni adjustment for multiple testing.

