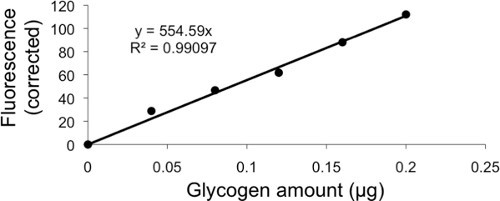
| glu. (μg) | 0 | 0.04 | 0.08 | 0.12 | 0.16 | 0.2 | |
| Raw Data Fluorescence (RDF) | fluo. | 60 | 88.8 | 106.7 | 121.8 | 148 | 172.1 |
| RDF - Background (fluorescence for 0 μg in standard curve) | correction | 0 | 28.8 | 46.7 | 61.8 | 88 | 112.1 |

| |||||||
| Raw Data Fluo. (RDF) | RDF - Background | (correction*1000) / slope standard curve | Volume of sample used to titrate glycogen | Raw data protein concen-tration | γ * volume sample | Glucose (ng) / protein total | |
| Total glucose concentration 1 | fluo. | correction | glucose (ng) | volume sample | γ (μg/μl) | protein total | glucose (ng/μg Pr.) |
| Sample 1 (CCL39-NX 1) | 65.8 | 5.8 | 10.5 | 20 | 0.07 | 1.4 | 7.5 |
| Sample 2 (CCL39-NX 2) | 64.1 | 4.1 | 7.4 | 20 | 0.11 | 2.2 | 3.4 |
| Sample 3 (CCL 39 HX 48 hr 1) | 177.3 | 117.3 | 211.5 | 4 | 0.22 | 0.88 | 240.3 |

An official website of the United States government
Here's how you know
Official websites use .gov
A
.gov website belongs to an official
government organization in the United States.
Secure .gov websites use HTTPS
A lock (
) or https:// means you've safely
connected to the .gov website. Share sensitive
information only on official, secure websites.