Figure 3.
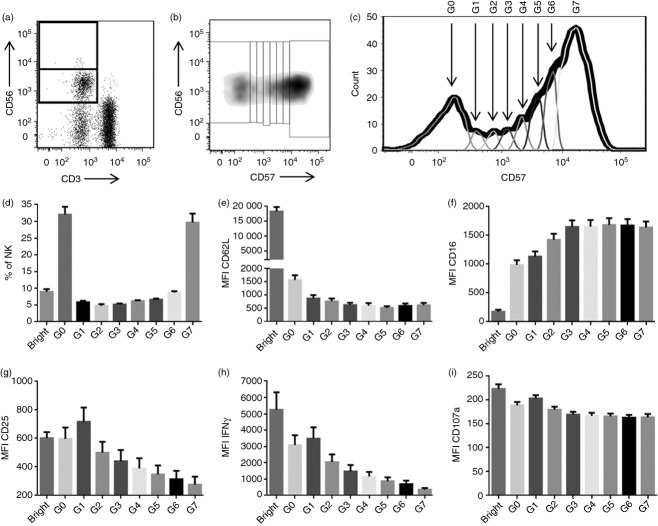
CD56 and CD57 define multiple distinct natural killer (NK) cell subsets. Representative flow cytometry plots showing gating of CD56bright and CD56dim NK cells (a) and corresponding dot plot (b) and histogram (c) showing gating of the CD56dim subset into seven subpopulations based on CD57 expression. The G0 population represents CD56dim CD57− cells; G1–6 are CD56dim CD57int cells; G7 are CD56dim CD57+ cells). (d–f) Ex vivo analysis of each subpopulation of NK cells (as defined in c) among NK cells from 32 donors: (d) mean (SEM) percentage of all NK cells which fall into each subpopulation; (e) mean (SEM) mean fluorescence intensity (MFI) of CD62L expression and (f) CD16 expression on each subpopulation. (g–i) Peripheral blood mononuclear cells from 32 donors were stimulated for 18 hr with high concentration of cytokines: mean (SEM) MFI of CD25 expression (g), interferon-γ (IFN-γ) expression (h), and CD107a expression (i) on each subpopulation. Bar charts represent means ± SEM, n = 32.

