Figure 1.
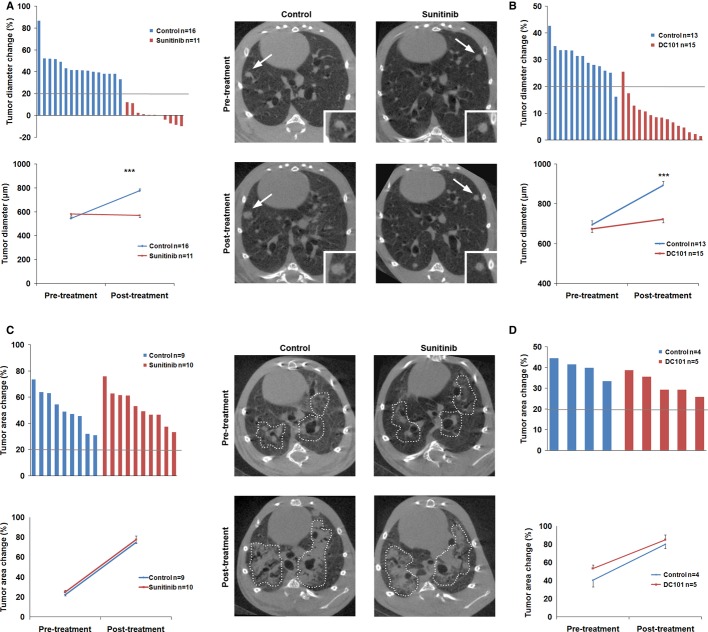
Sunitinib induces a differential tumor response between adenocarcinoma (ADC) and squamous cell carcinoma (SCC).
A, B In the urethane-induced ADC mouse model, sunitinib (A) and DC101 (B) treatments stabilized tumor growth; Top: Waterfall plots of tumor response to sunitinib (A) or DC101 (B) treatments of ADC-bearing mice (the bold line at 20% indicates disease progression as defined by response in human cancers criteria). Tumor diameter change was calculated for each mouse taking the initial size of every lesion as reference. Each column represents the average tumor diameter change in each mouse after 5 weeks of treatment. Bottom: The pre-and post-treatment mean size for each group is presented in a line plot. Representative micro-CT images of ADC tumors show the progression of the disease in the control group and the stabilization of tumor growth in the sunitinib group. Lung ADC lesions (arrows) are shown at higher magnification (inset). Data are presented as mean ± standard error.
C, D In the N-nitroso-tris-chloroethylurea-induced SCC model disease progression was observed. Top: Waterfall plots of SCC tumor response to sunitinib (C) or DC101 (D) treatments showing the percentage of area change for each mouse. Bottom: The pre-and post-treatment mean tumor area for each group is presented in a line plot. Representative micro-CT images of SCC tumors (dotted line) show the progression of the disease in the sunitinib and vehicle (control) groups. Data are presented as mean ± standard error.

