
Figure 5.
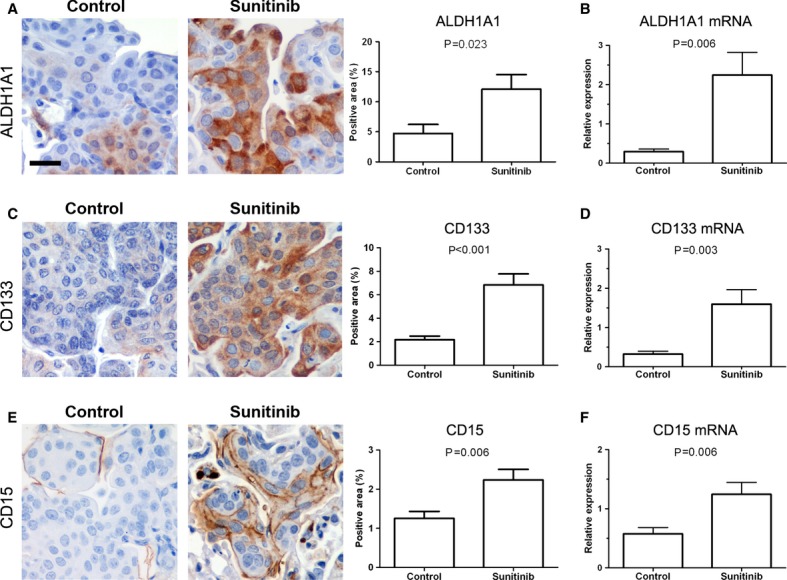
Sunitinib induces the expression of stem cell markers in squamous cell carcinoma tumors.
A, B ALDH1A1 expression. Representative images of immunohistochemical analysis of ALDH1A1 in vehicle (control) and sunitinib-treated mice (A). Automatic quantification of tumor cell staining was performed. The mRNA expression of ALDH1A1 was evaluated by quantitative PCR (B). Each value was normalized to the reference gene (GUSB) and the expression in paired normal tissue was used for calibration. Scale bar, 25 μm. Data are presented as mean ± standard error.
C, D CD133 expression analysis. Representative analysis of CD133 expression by immunohistochemistry (C) and by quantitative PCR (D). Each value was normalized to the reference gene (GUSB) and the expression in paired normal tissue was used for calibration. Scale bar, 25 m. Data are presented as mean ± standard error.
E, F CD15 expression analysis by immunohistochemistry (E) and by quantitative PCR (F). Each value was normalized to the reference gene (GUSB) and the expression in paired normal tissue was used for calibration. Scale bar, 25 μm. Data are presented as mean ± standard error.