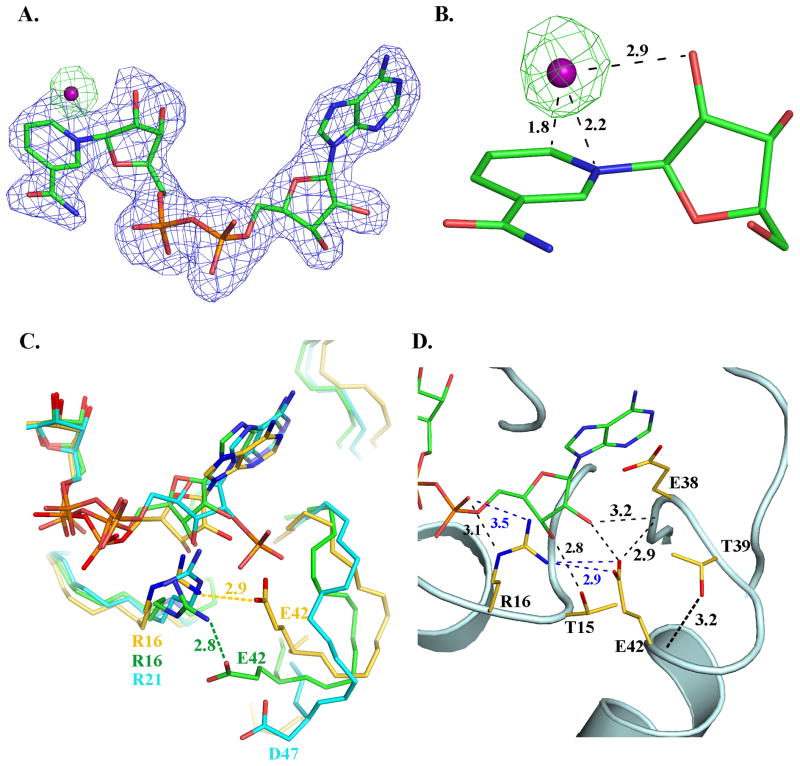
FIGURE 4.
Co-factor binding in BaiA2. (A) Unbiased (mFo-DFc) electron density maps: blue - before inclusion of NAD+ and OH− (contour level 0.17 e−/Å3 (3 rmsd)); green- before inclusion of OH− but after addition of NAD+ (contour level 0.14 e−/Å3 (3 rmsd)). C, N, O and P atoms are colored green, blue, red and orange, respectively. The O atom of OH− of the nicotinamide-OH− adduct is depicted as a purple sphere. (B) Interaction of OH− with the nicotinamide moiety. Numbers indicate distances in Å. (C) Comparison of the interaction involving a conserved Arg and the residue equivalent to Glu42 in other related SDRs. C atoms are colored gold, cyan and green, respectively for BaiA2, mannitol dehydrogenase (MtDh; PDB Code: 1H5Q) and 3α, 20β-hydroxysteroid dehydrogenase (PDB Code: 2HSD). Label of residues and distances of interaction are colored according to the carbon atoms of the respective structure. (D) Key interactions involving residue Glu42 in the adenine moiety binding site. Dashed black colored lines indicate hydrogen bonding interactions, whereas blue colored dashed lines indicate a salt bridge interaction. Numbers indicate distances in Å. N and O atoms are colored blue and red, respectively.

