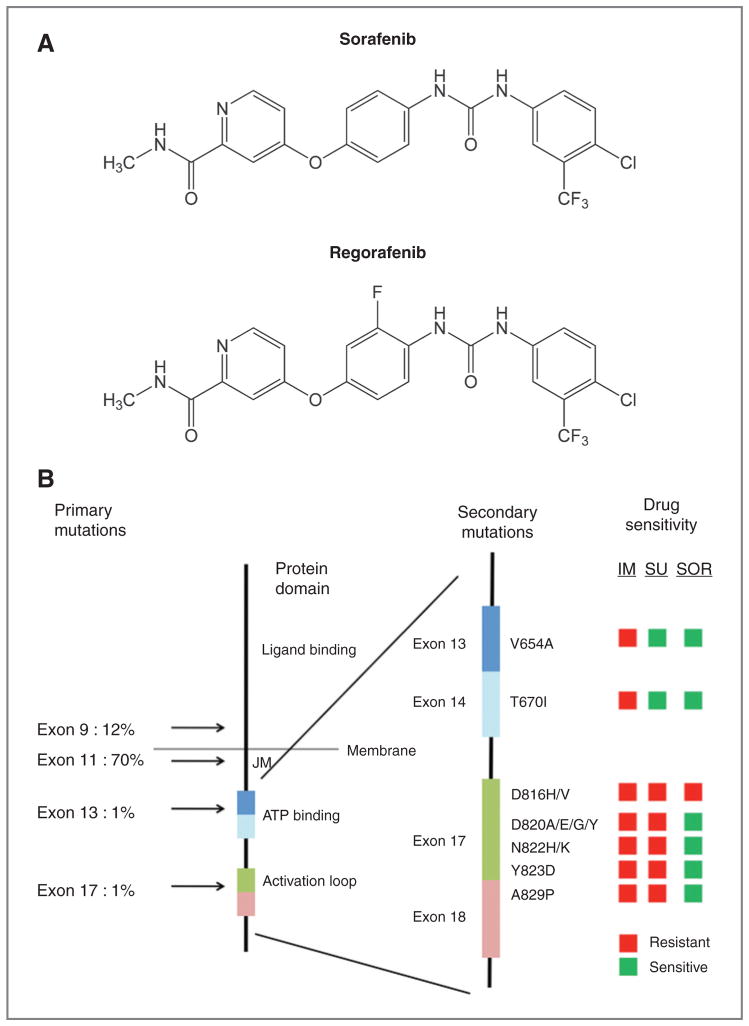
Figure 4.
A, chemical structures of sorafenib and regorafenib. B, graphical comparison of the potency of imatinib, sunitinib, and sorafenib for imatinib-resistant KIT mutations (cellular IC50). The left-most stick figure depicts the protein structure of the KIT protein, with location and frequency of primary GIST mutations to the left of the figure and the location of critical functional domains indicated on the right side of the figure (JM, juxtamembrane domain). The right-most stick figure is an exploded view of a portion of the cytoplasmic domain, with labeling to indicate the location of critical exons (colored rectangles). The location and composition of amino acid substitutions associated with secondary KIT kinase mutations are indicated on the right of the exploded stick figure (e.g., V654A). The traffic light boxes to the right of the figure indicate sensitivity of the indicated mutations to imatinib (IM), sunitinib (SU), or sorafenib (SOR). Drug sensitive mutations were defined as those with a cellular IC50 in our model system of less than 200 nmol/L for sunitinib and less than 1,000 nmol/L for imatinib and sorafenib.

