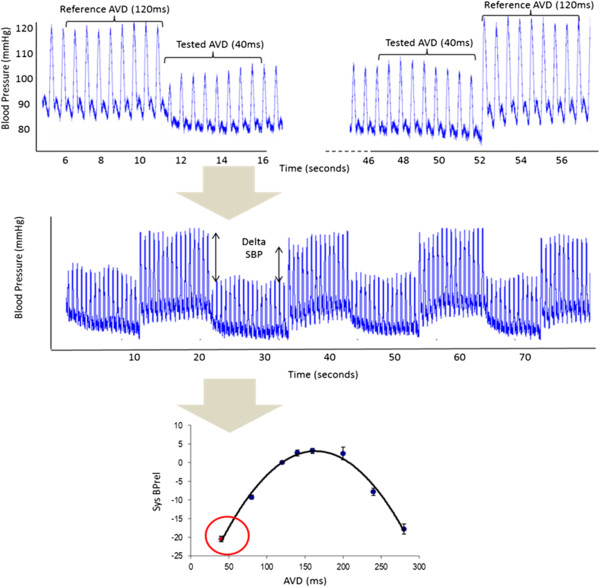
Figure 2.
Calculating the relative change in systolic blood pressure (Sys BPrel (mmHg) between a reference atrio-ventricular delay (AVD) of 120 ms and a tested AVD of 40 ms. Eight beats from the continuous arterial pressure waveform are averaged from each AVD (top picture), this process is repeated to include a minimum of 6 transitions for each AVD tested (middle picture). SBPrel plotted against the AVD (lower picture) is an average of the change in systolic blood pressure (8-beat average).

