Figure 2.
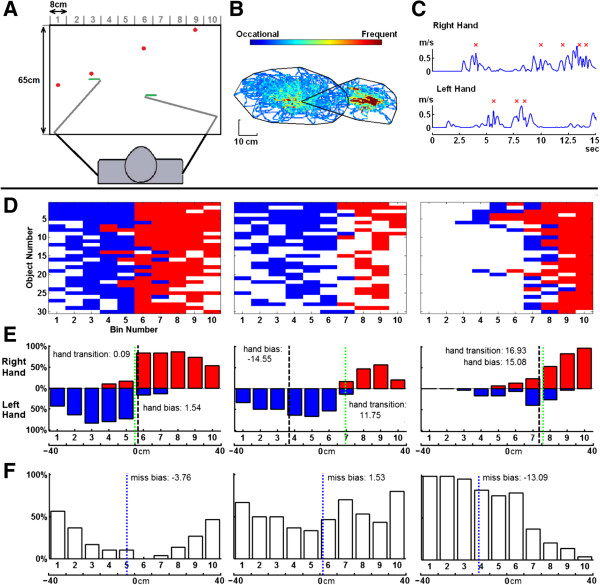
Object hitting task and example performance. A) Workspace for task. Balls move towards the participant from one of 10 bins (bins not displayed to participant). B) Hand trajectories for the left and right hands during the task of an exemplar, right-affected participant with stroke. The black lines define hand movement area for each hand. C) Hand speed for a few seconds during the task. Successful ball hits are marked with a red x. D) Performance grids for three exemplar participants (left: control, middle, right-affected participant, right, left-affected participant with visuospatial neglect). The x-axis represents the 10 bins from which balls are dropped. The y-axis corresponds to the 30 random blocks, where the top row corresponds to the first random block (easiest) and the last row corresponds to the last block. Successful hits made with the right hand are colored red, hits with the left hand are coloured blue and misses are white. E) Hits distribution of right (red) and left (blue) hands. Hand transition is shown with the green line. F) Distribution of misses with miss bias shown with the blue line.

