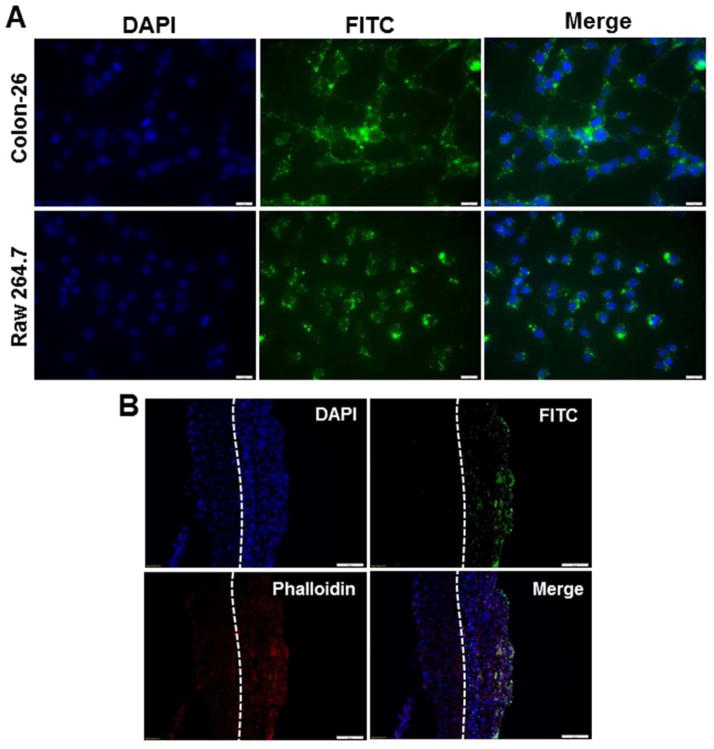
Figure 3.
Uptake profiles of scCD98-functionalized FITC-siRNA-loaded NPs (weight ratio, 40:20:1) by Colon-26 cells, RAW 267.4 macrophages and colitis tissue. (A) Cellular uptake of NPs by respective Colon-26 cells and RAW 267.4 cells. Cells were treated with NPs (green) and processed for fluorescence staining. FITC-siRNA with the concentration of 100 nM was used for the transfections. Fixed cells were stained with DAPI for visualization of nuclei (purple). Scale bar represents 10 μm. (B) Colitis tissue uptake of NPs after 6 h of co-incubation. Colitis tissues were treated with NPs (green), sectioned and processed for fluorescence staining. FITC-siRNA with the concentration of 200 nM was used for the transfections. Fixed tissues were stained with Alexa Fluor 568 phalloidin and DAPI to visualize actin (red) and nuclei (purple), respectively (n=3). Scale bar represents 50 μm.

