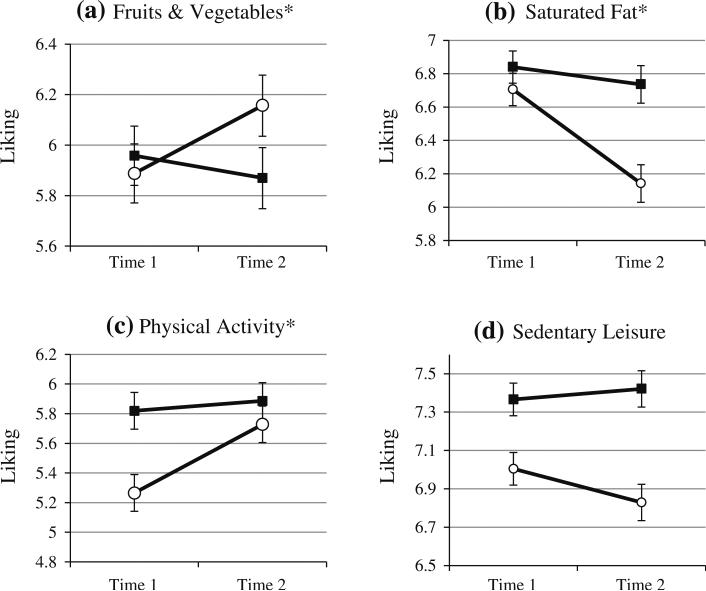
Fig. 1.
Financial motivation predicting changes in liking (FV, Fat, PA, and Sed). a Fruits and vegetables*. b Saturated fat*. c Physical activity* d Sedentary leisure. Note: Asterisk indicates a significant financial motivation × time interaction. The “High” and “Low” financial motivation slopes represent predicted slopes associated with plus and minus one standard deviation from the sample mean, respectively, on the continuous financial motivation scale. Key:  High Financial Motivation (+1 SD),
  Low Financial Motivation (–1 SD)

