2.
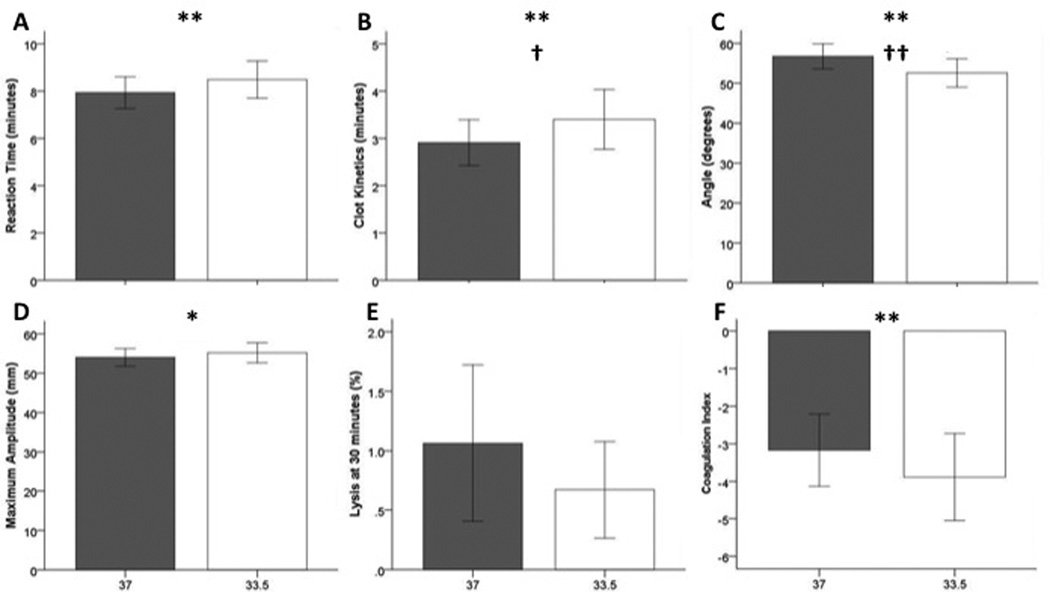
Effect of temperature on TEG parameters. The gray bars represent 37°C while the white bars represent 33.5°C. All bars represent mean ± 95% confidence interval. Significant differences by paired T-tests are shown with asterisks (*p<0.05, **p<0.001). Significant adjusted p values are marked with daggers (†p<0.05, ††p<0.01).

